AGV & forklift traffic in warehouse
Context
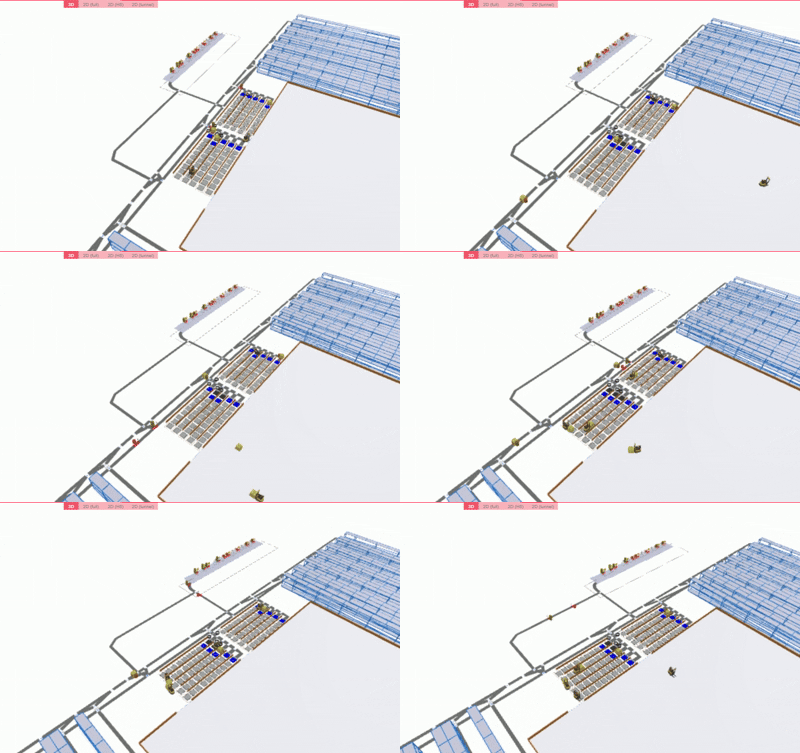
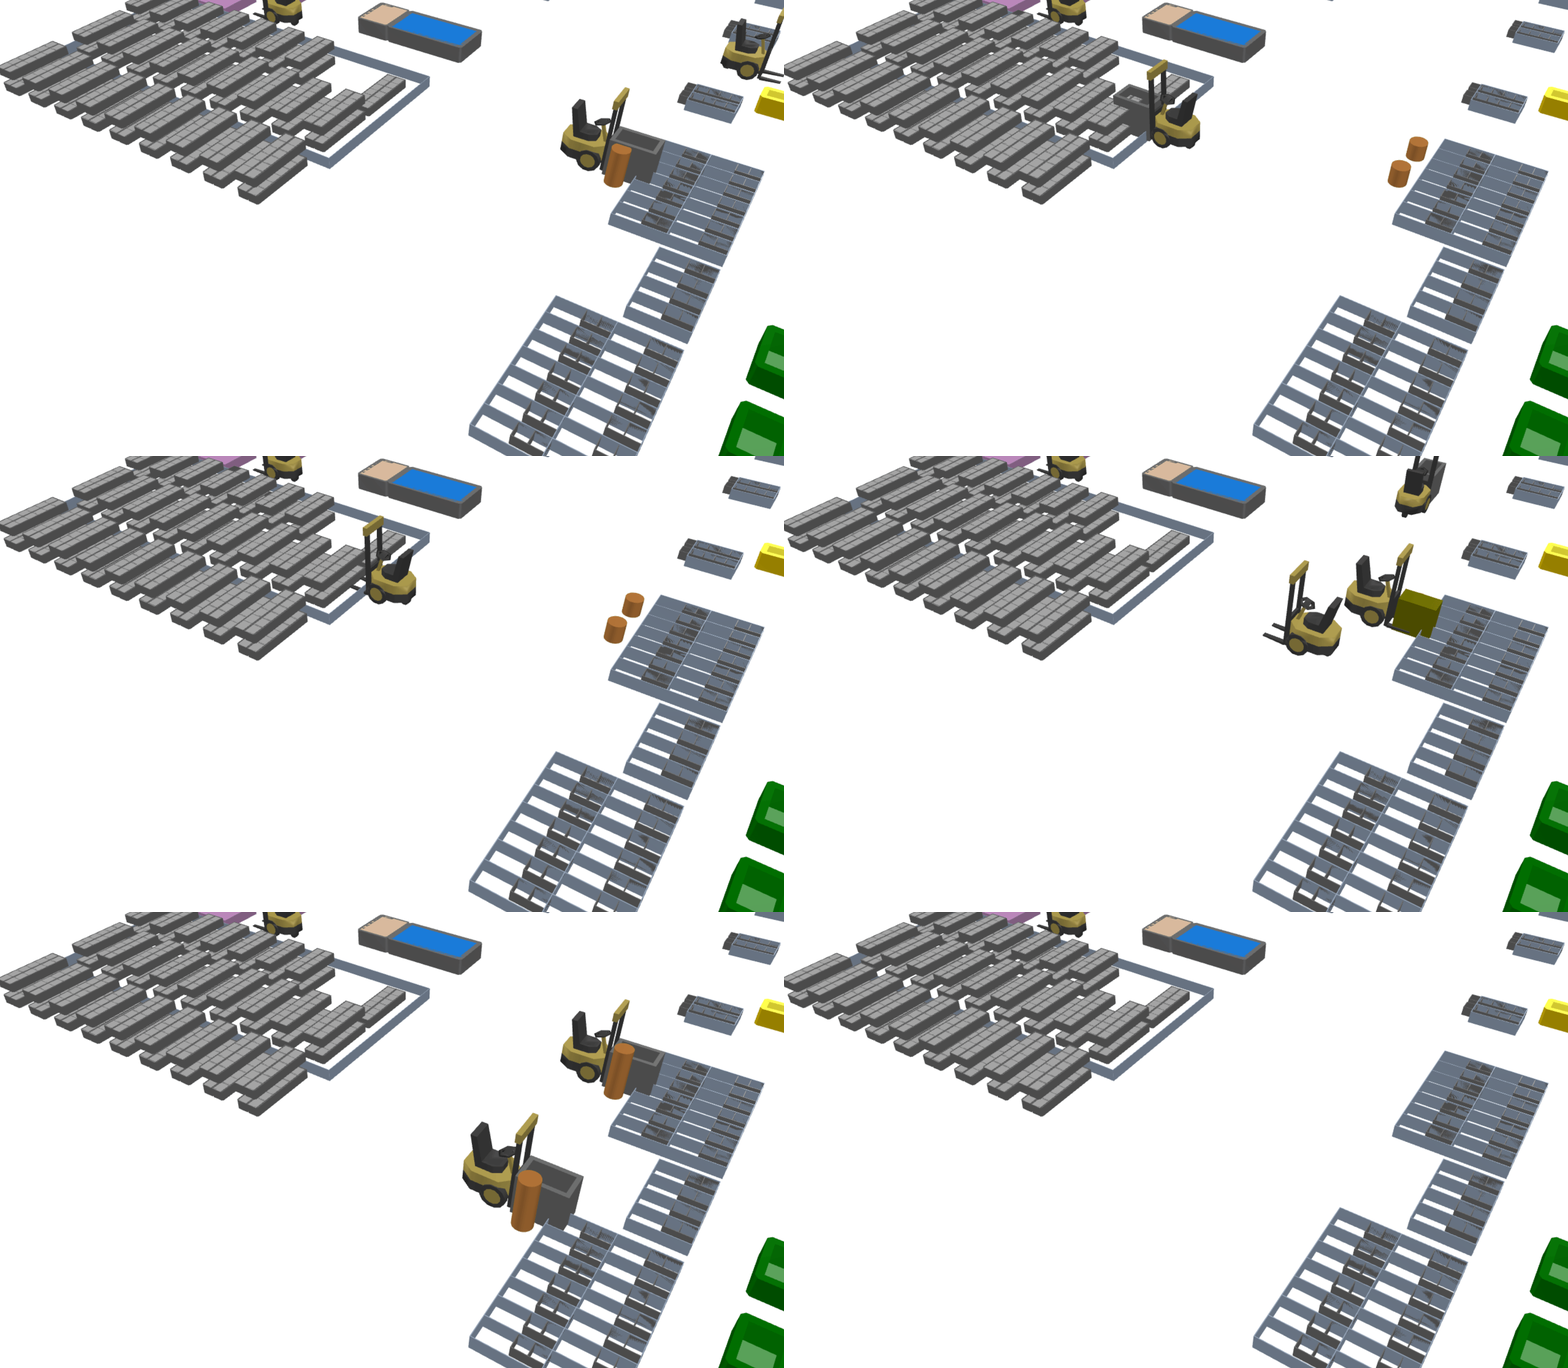
The client operates a mixed fleet of (human-driven) forklifts and AGVs within one of their largest warehouses.
This leads to conflicts and stoppages due to tight aisles and different operating speeds. Moreover, the layout and logic of handover areas (where forklifts drop pallets to be picked by AGVs) was designed from intuition and static analysis.
The client wanted to:
This leads to conflicts and stoppages due to tight aisles and different operating speeds. Moreover, the layout and logic of handover areas (where forklifts drop pallets to be picked by AGVs) was designed from intuition and static analysis.
The client wanted to:
- quantify actual conflict situations
- adjust handover area logic
- play with different layouts and traffic flows
Approach
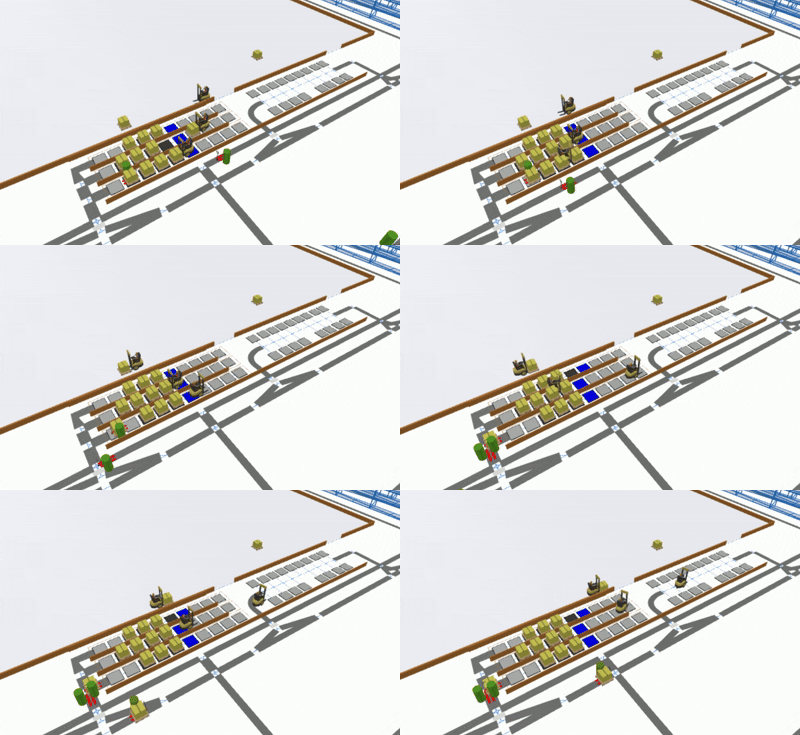
In under 20 man days, I created a flexible AnyLogic model of their operations, including:
Client impact
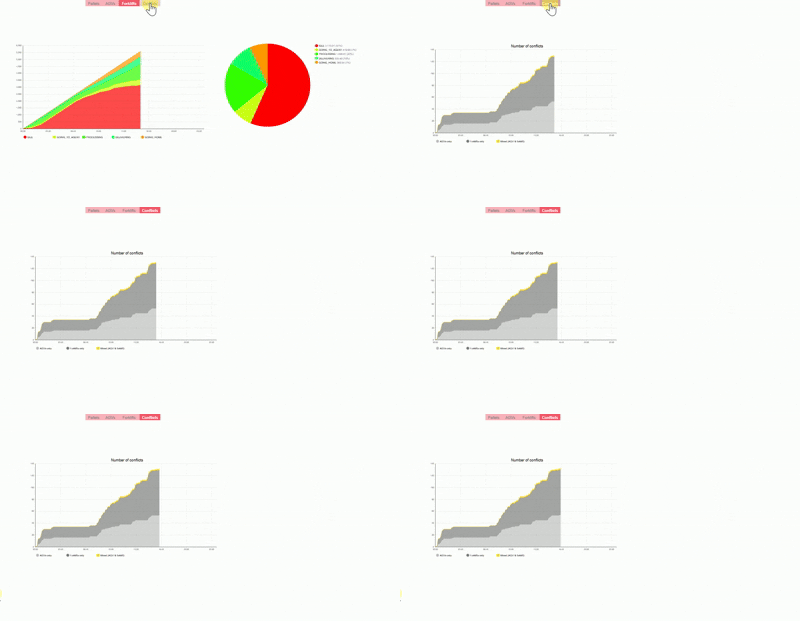
The model can be used to investigate the impact of operational changes such as:
Tiles warehouse logistics
Context
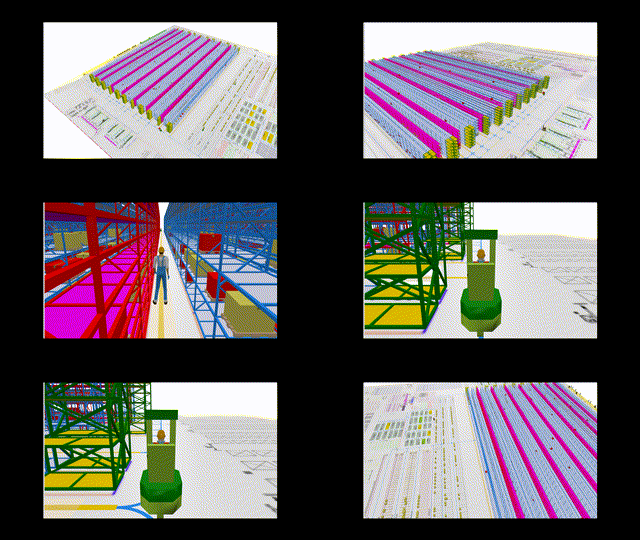
The client operates a large tile warehouse in the eastern US, handling orders from professional and private clients of any size, complexity and quantity.
Existing warehouse operations often led to consolidation delays. New layout and storing strategies were developed but needed a simulation to test their impact for feasibility.
Existing warehouse operations often led to consolidation delays. New layout and storing strategies were developed but needed a simulation to test their impact for feasibility.
Approach

Within 4 weeks, I modelled the existing warehouse operations, including:
Validation showed 80-85% accuracy, allowing us to proceed implementing the new layout and storage policies for comparison.
- real orders and storage locations
- zoned picking and cart weight limits
- reach and turret truck ops
- real racks and floor storages
- aisle traffic limits
- replenishment
Validation showed 80-85% accuracy, allowing us to proceed implementing the new layout and storage policies for comparison.
Client impact
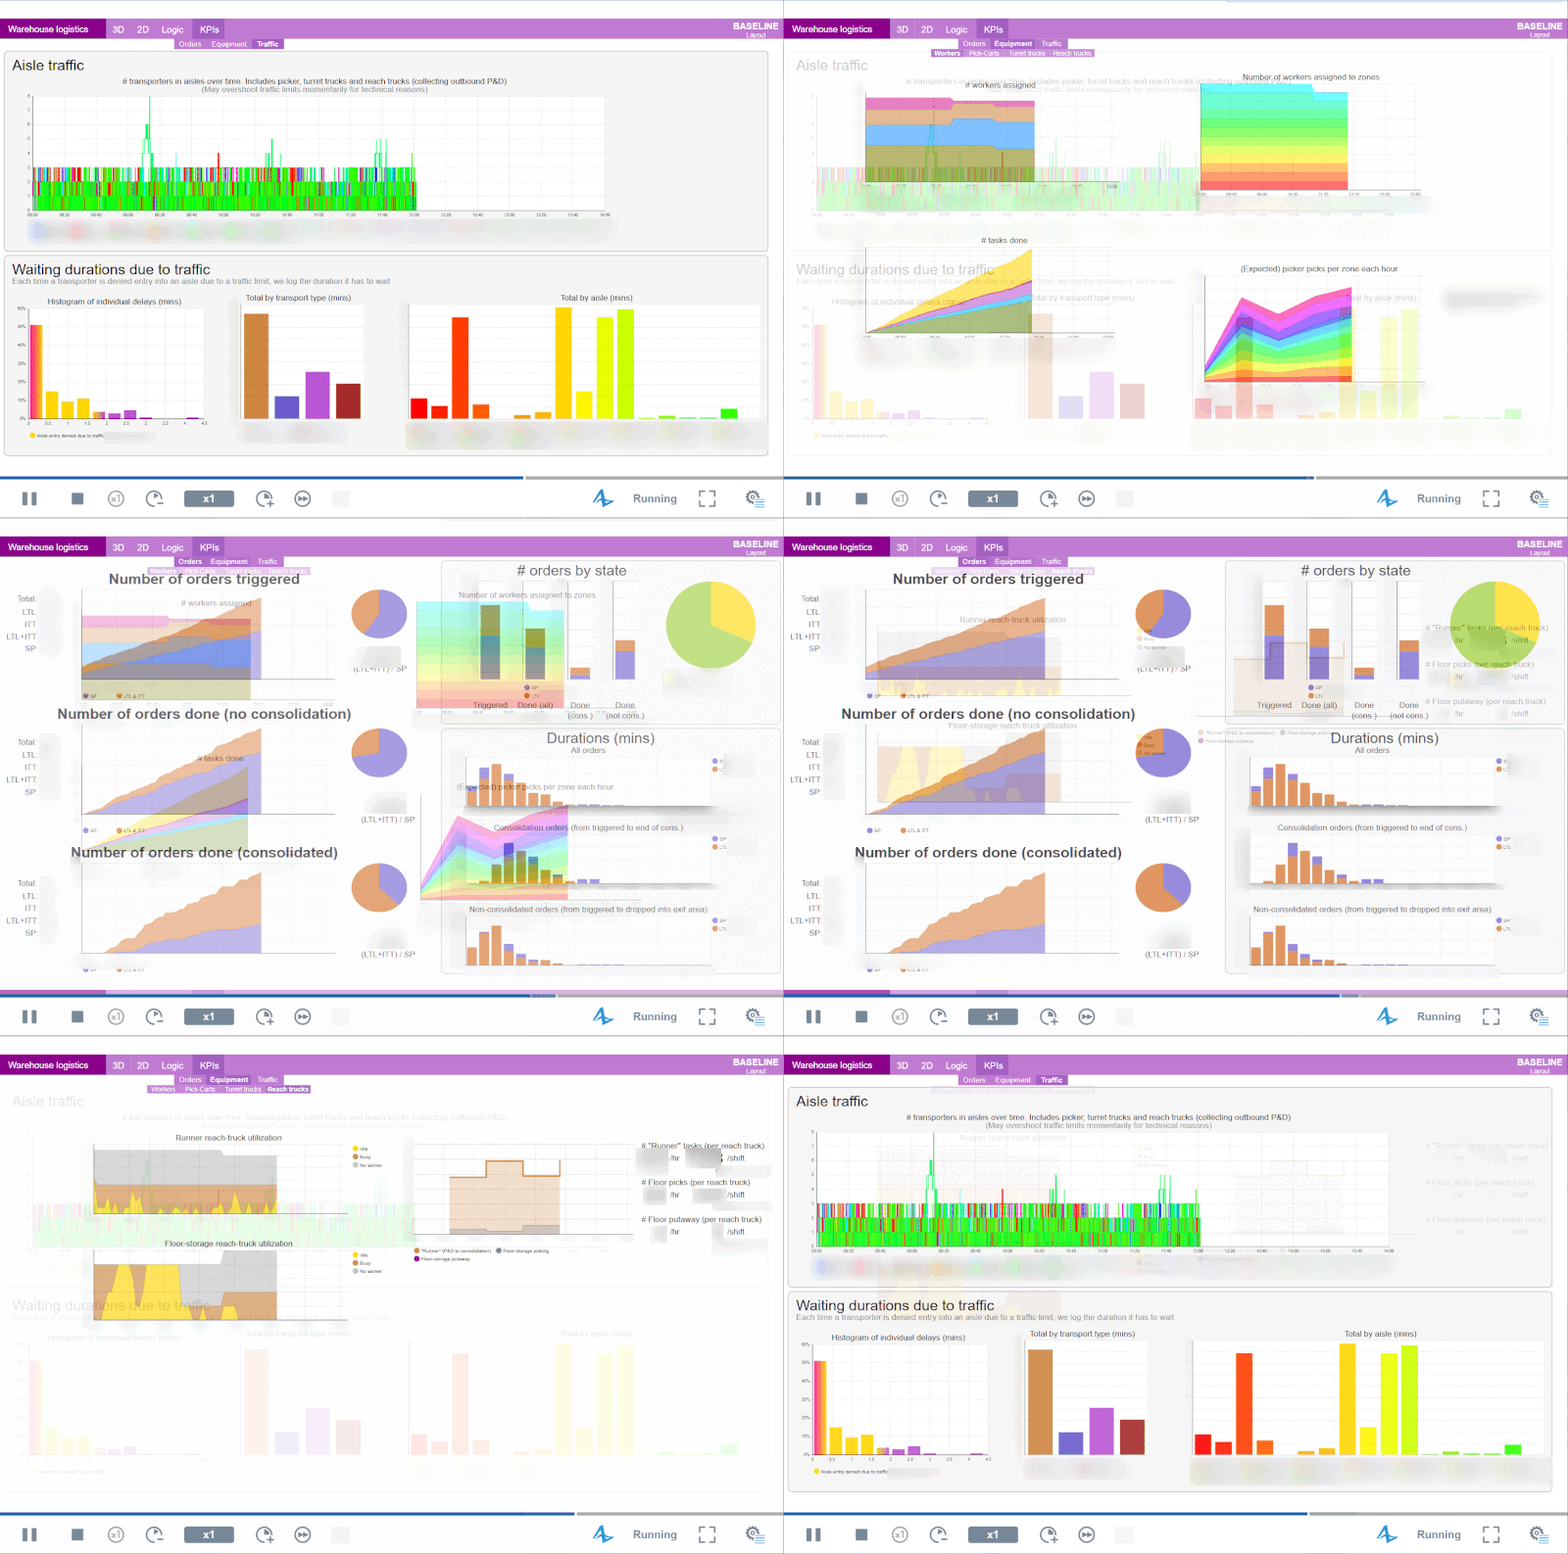
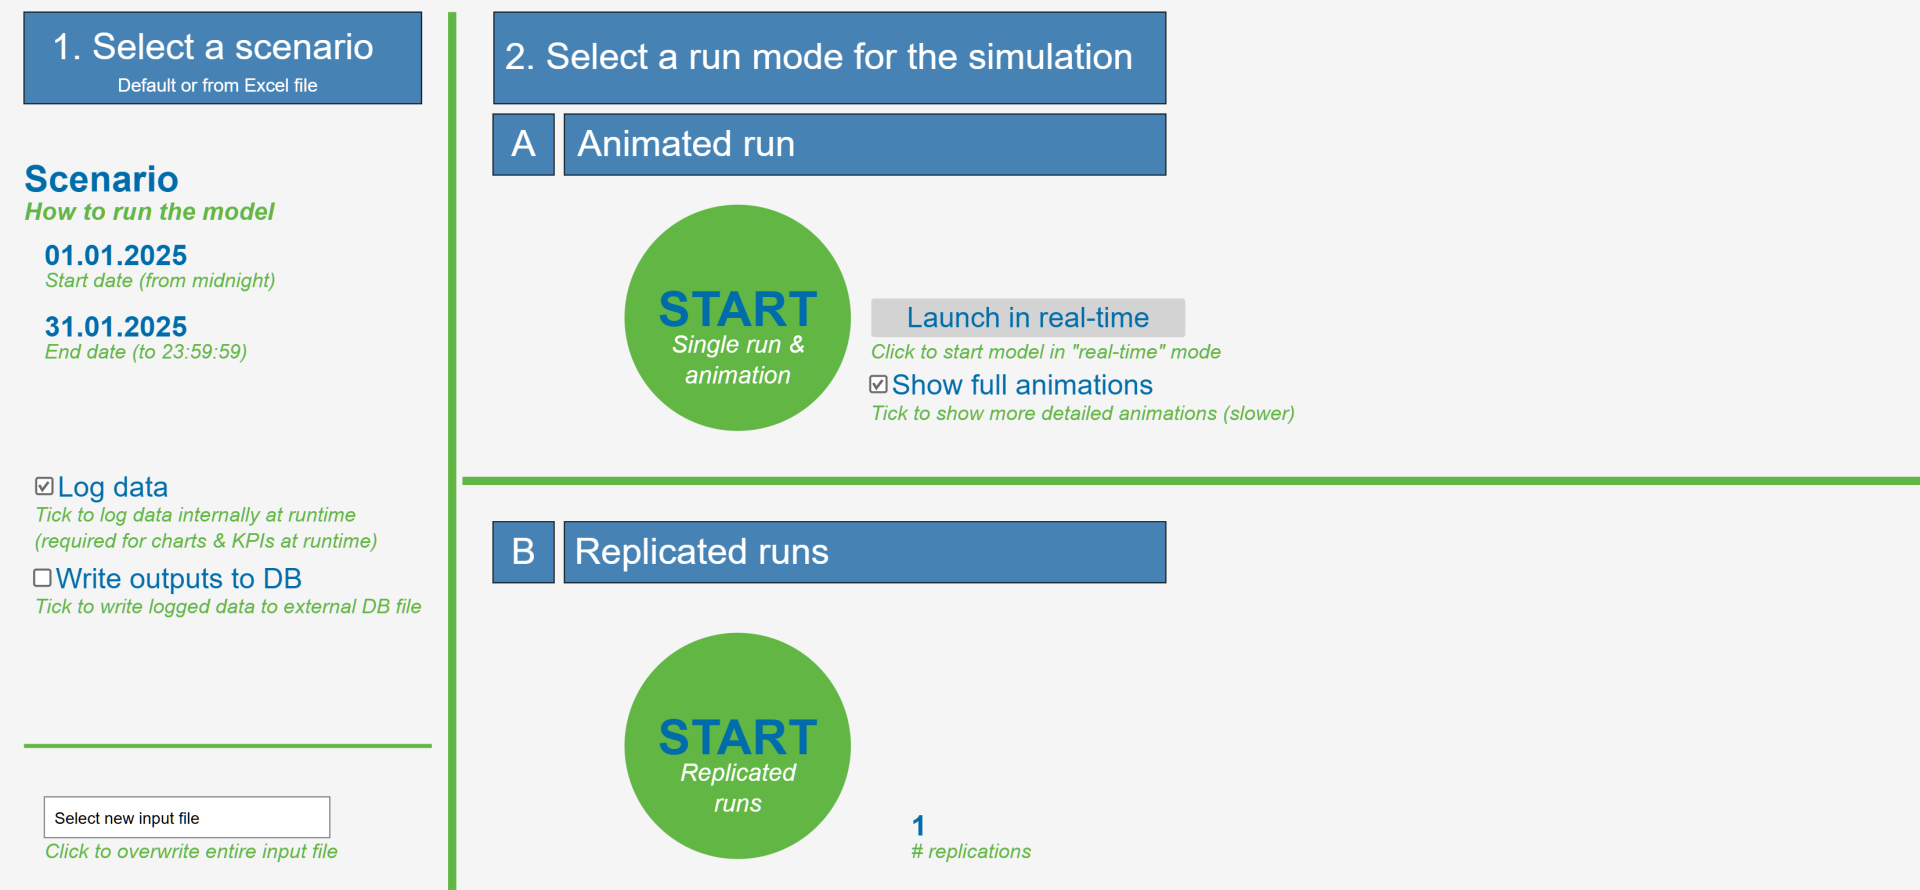
The client was able to run their own scenarios and layouts via Excel inputs.
The showed that a two-sided load/unload approach with wider aisles and clever storage locations could improve consolidation delays massively, while not accruing more traffic.
Also, reducing picker zoning added a large benefit to OEE.
The showed that a two-sided load/unload approach with wider aisles and clever storage locations could improve consolidation delays massively, while not accruing more traffic.
Also, reducing picker zoning added a large benefit to OEE.
Internal logistics at a "giga-factory"
Context
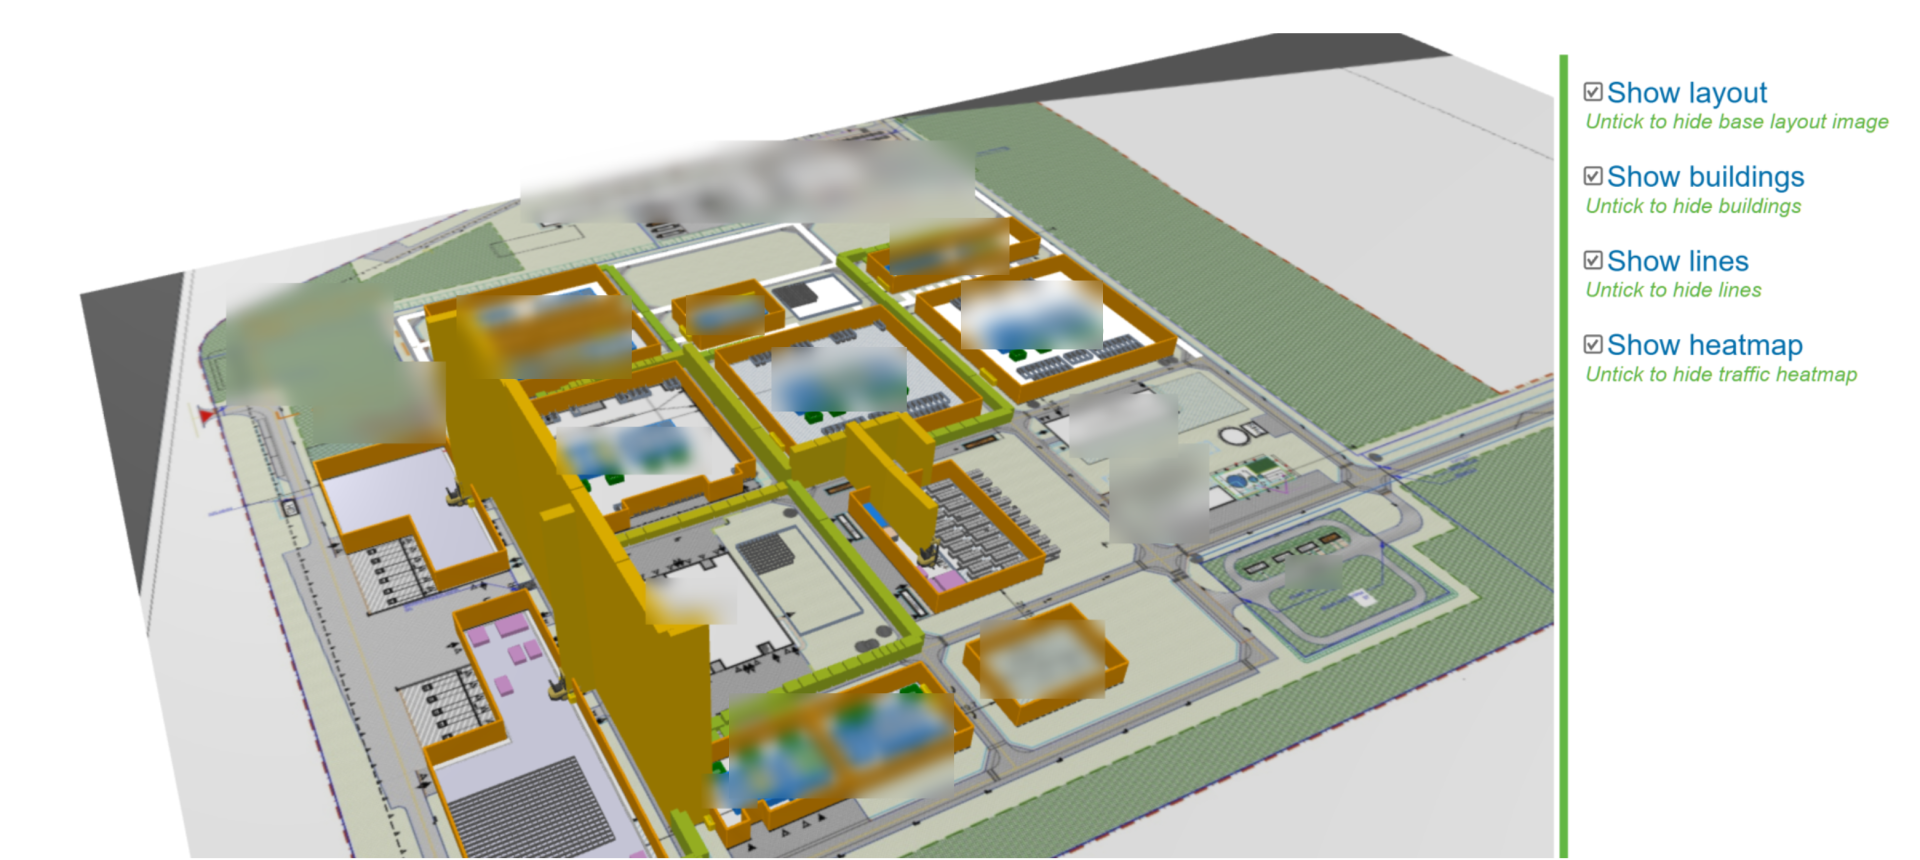
A new industrial plant was planned by the client. From historical planning experience, it was clear that only a simulation model can inform about bottlenecks and transport needs.
An AnyLogic model was desired based on positive prior experience, due to the unlimited flexibility to define transport details: routes, capacities, etc.
Another core requirement was to enable production of several end products with complex schedule requirements.
An AnyLogic model was desired based on positive prior experience, due to the unlimited flexibility to define transport details: routes, capacities, etc.
Another core requirement was to enable production of several end products with complex schedule requirements.
Approach
A data-driven model was created from scratch within 10 weeks. It was fully configurable, including:
Combined with an elegant, object-oriented architecture, the client was able to run complex experiments of any expected scenario.
Client impact
The model is used to decide many different operational questions such as:
Army logistics
Context
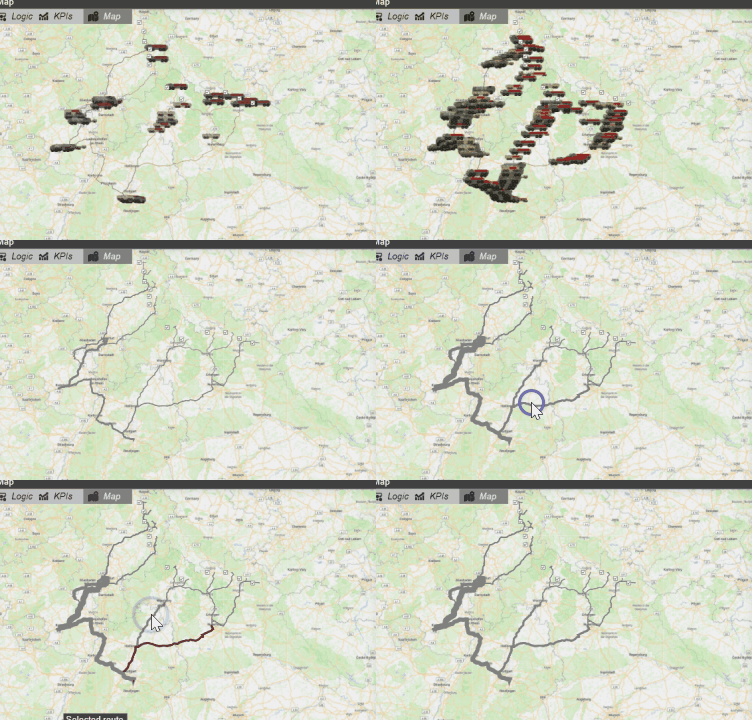
The client plans and manages large logistics movements using traditional methods currently.
However, modern planning requires faster methods to plan, test and visualize operations. Moreover, downtimes and random events currently offset the best planning.
The client wanted to introduce and convince army generals of the need for simulation-based planning via a MVP.
However, modern planning requires faster methods to plan, test and visualize operations. Moreover, downtimes and random events currently offset the best planning.
The client wanted to introduce and convince army generals of the need for simulation-based planning via a MVP.
Approach

Within one week, I built a data-driven model that sends various items from army bases to lower-level groups hierarchically.
Uniquely, the GIS-based model allows users to click actual routes and observes KPIs about them (road usage, traffic issues...).
Due to its architecture, the model can be scaled easily and allows for flexible deployments.
Uniquely, the GIS-based model allows users to click actual routes and observes KPIs about them (road usage, traffic issues...).
Due to its architecture, the model can be scaled easily and allows for flexible deployments.
Client impact
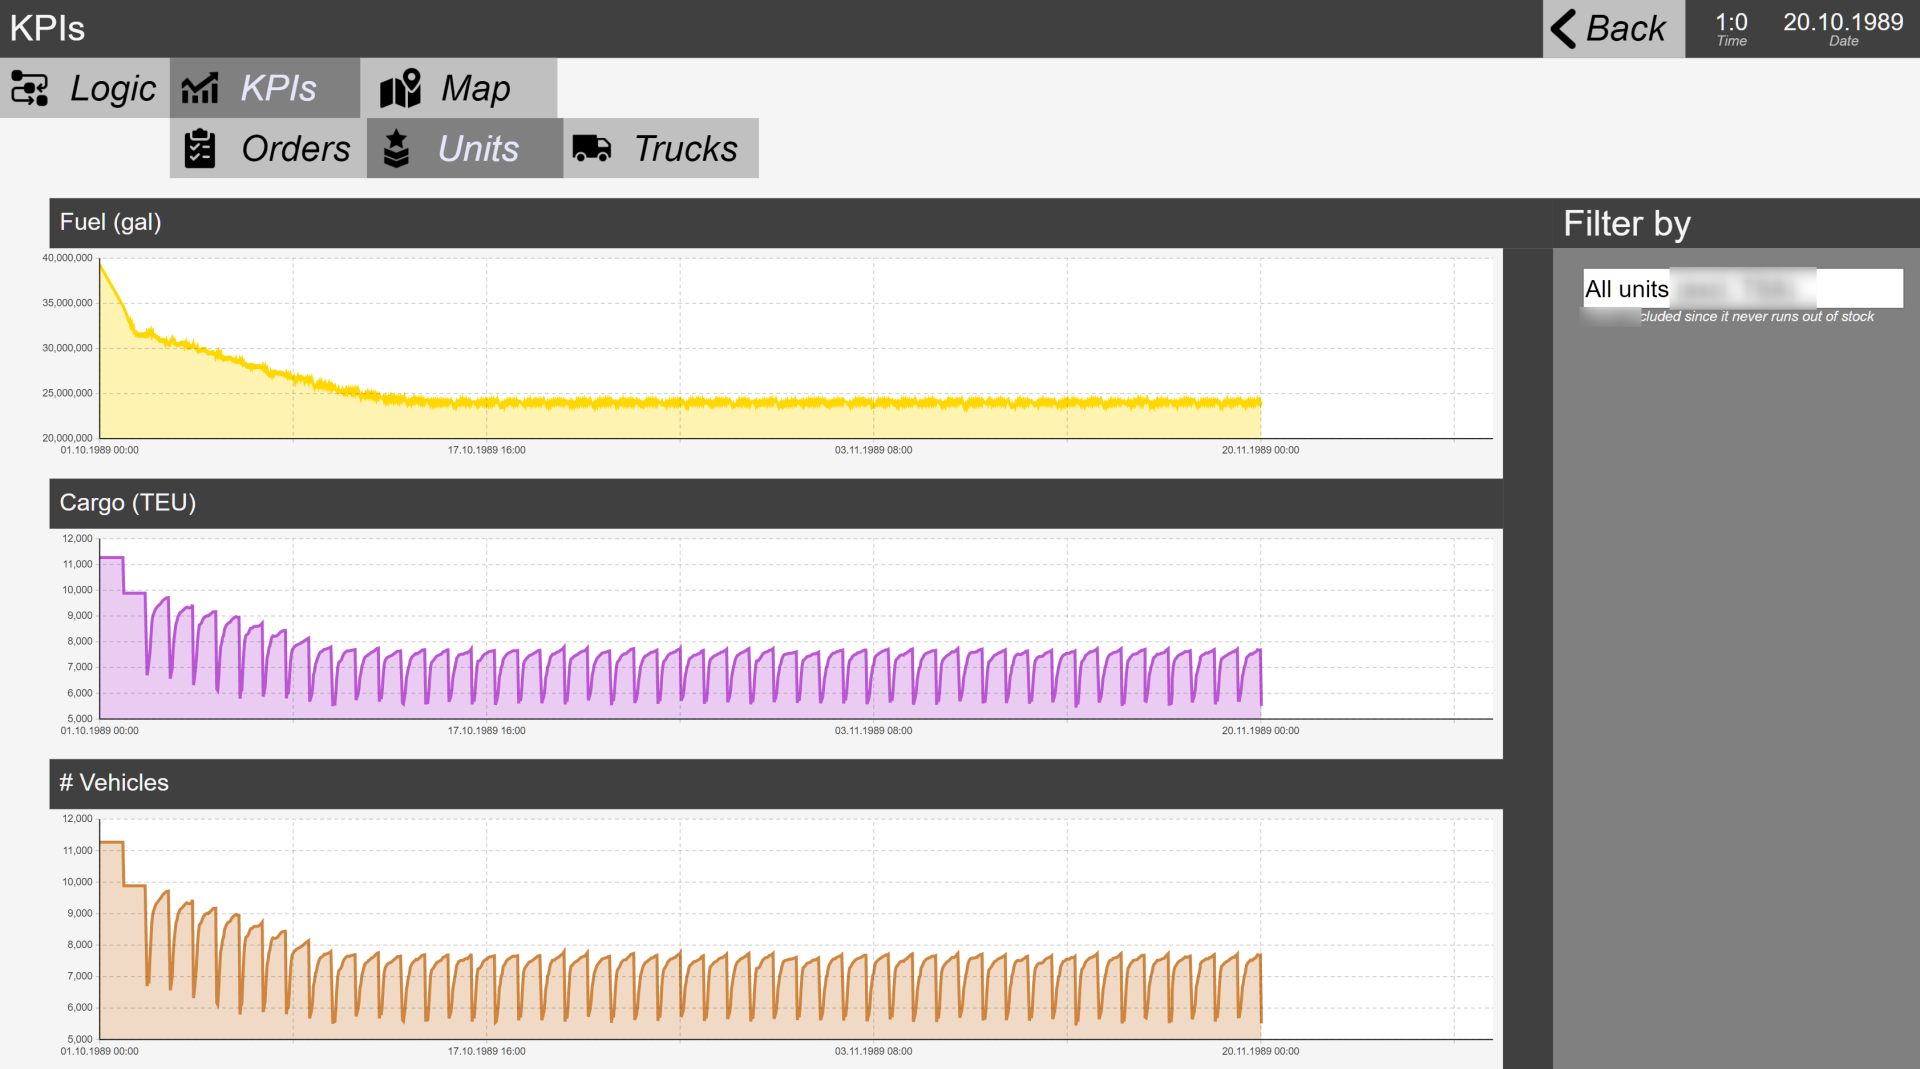
The model was shown to senior organizational leadership and sparked discussions on improved logistics planning.
The model was received very well. A team of the army's IT specialists received AnyLogic training from me and now carry on modelling.
The model was received very well. A team of the army's IT specialists received AnyLogic training from me and now carry on modelling.
Airport security for Snowflake analytics
Context

The client wants to convince several airports (in the same country) to collaborate on their huge datasets to improve service and reduce flight delays.
Part of the vision is to simulate various airport operations continuously. This would allow operators to view and adjust operational decisions (or automate it).
As part of an MVP, I was asked to design a generic airport security model.
Part of the vision is to simulate various airport operations continuously. This would allow operators to view and adjust operational decisions (or automate it).
As part of an MVP, I was asked to design a generic airport security model.
Approach
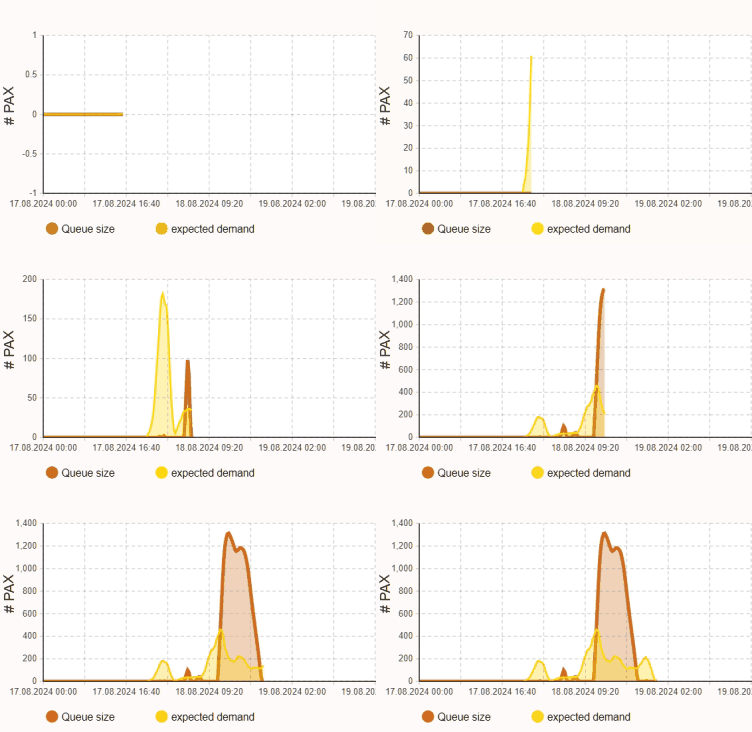
The challenge here was not the model, itself data-driven and fully scalable.
Instead, this was the first time that an AnyLogic model would be fed by a Snowflake data lake.
Moreover, the model writes back to the data lake for downstream analytics for insights.
The model was triggered from an app and runs on a private AnyLogic cloud itself.
Instead, this was the first time that an AnyLogic model would be fed by a Snowflake data lake.
Moreover, the model writes back to the data lake for downstream analytics for insights.
The model was triggered from an app and runs on a private AnyLogic cloud itself.
Client impact

The client was able to demo a full end-to-end analytics pipeline: An automated dashboard triggers a simulation run with latest "live" data inputs, awaits (replicated) simulation results and feeds them back into the dashboard.
This led to favourable reviews, ongoing discussions and potential airport investments.
This led to favourable reviews, ongoing discussions and potential airport investments.
Optimized packaging
Context

The client implemented an Excel-driven packaging optimizer. It determined the best way to package warehouse parcels, containers and crates into a storage shelf.
However, it was cumbersome and slow to animate this, making it hard to communicate to the end client how it will work.
However, this was crucial for end-client buy-in.
However, it was cumbersome and slow to animate this, making it hard to communicate to the end client how it will work.
However, this was crucial for end-client buy-in.
Approach

Within a total of four hours (!), I designed an agent-based model that loads the Excel inputs and displays them interactively.
First, I formatted the root data to follow a clean database structure.
Next, I designed a powerful agent-based hierarchy that applies the data: individual container & items dimension themselves in 3D-space.
Last, I included a data-driven animation setup to show how filling the racks would look like.
Client impact
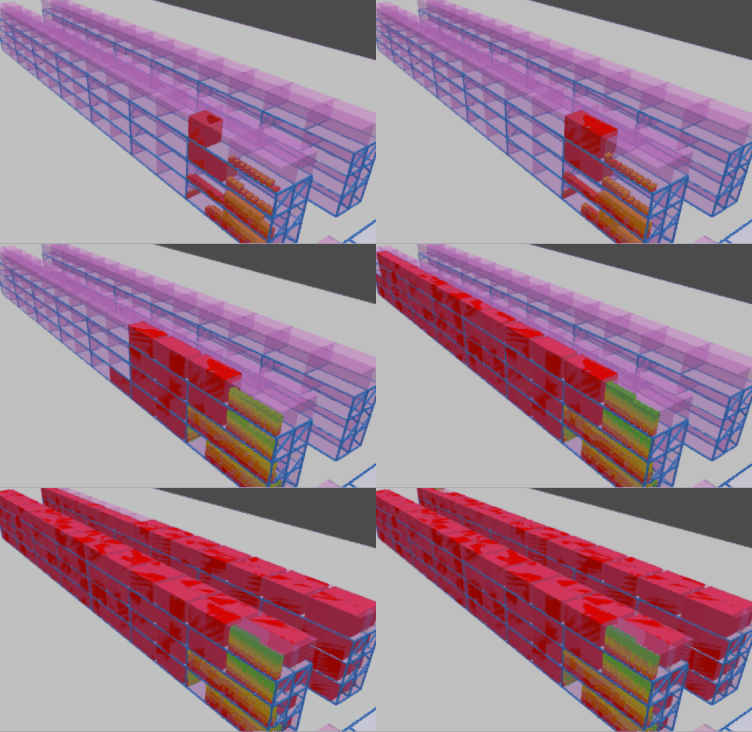
The client struggled to animate the data in AnyLogic. By pulling me in, they were able to achieve an initial working model within 2 hours.
After 4 hours, the model was able to work as intended, saving the client many days of research and tinkering. Plus, it allowed for many easy adjustments such as animation speeds, coloring, data presentation, etc.
The end client was able to grasp various optimization scenarios easily and adjust their warehouse strategies accordingly.
Car battery factory
Context
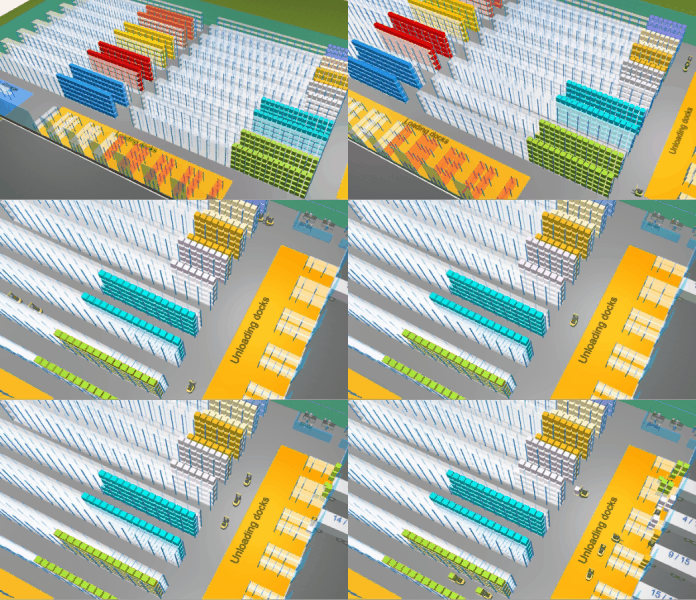
The client planned a new car-battery plant. No such plant has been designed previously, so many operational questions had no answer.
How many forklifts/AGVs would be needed? How will bottlenecks develop? Will there be traffic issues?
Static analysis could not help as the causal dynamics could not be captured.
How many forklifts/AGVs would be needed? How will bottlenecks develop? Will there be traffic issues?
Static analysis could not help as the causal dynamics could not be captured.
Approach
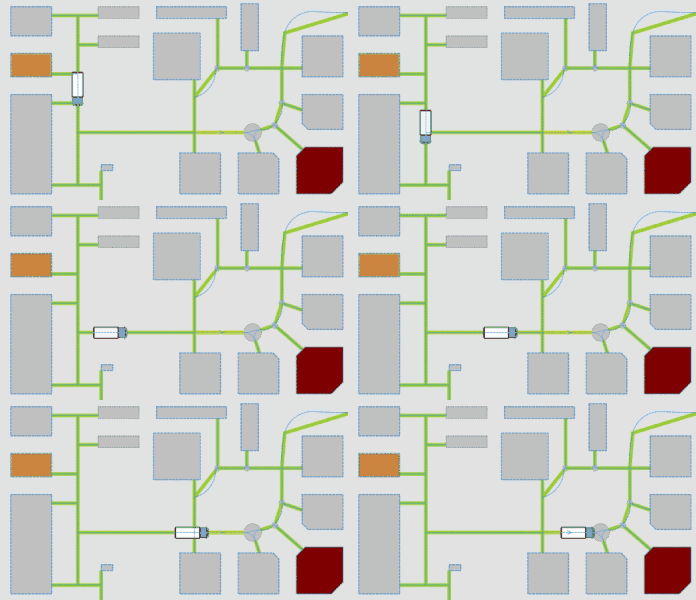
I created a fully data-driven model of the planned site, including all production lines, buffer areas, vehicle fleets and even flowbin fleets.
Vehicles deliver/collect flowbins to/from lines. Each line has internal tanks and flowbins actually "pour" their materials into lines, elegantly modeling fluid operations.
We monitor traffic using my custom network traffic module with bespoke path-finding.
Vehicles deliver/collect flowbins to/from lines. Each line has internal tanks and flowbins actually "pour" their materials into lines, elegantly modeling fluid operations.
We monitor traffic using my custom network traffic module with bespoke path-finding.
Client impact
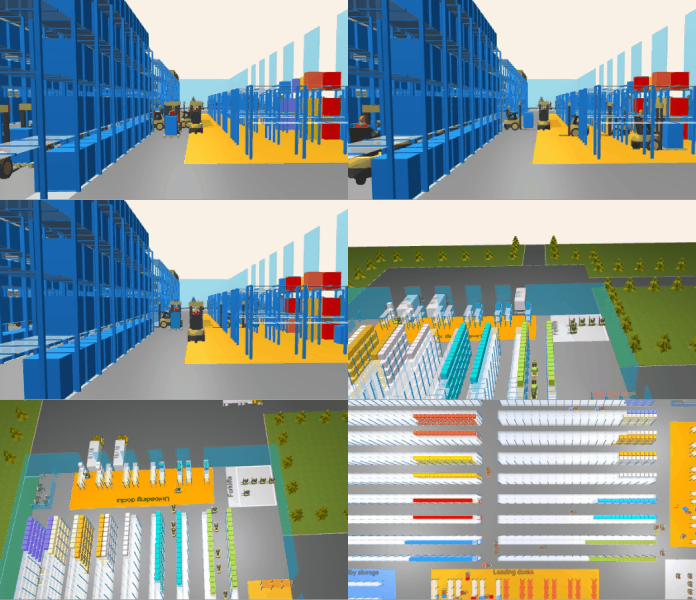
Initially, the model was used to estimate fleet sizes only. However, due to the flexibility of the model, it now is used for much deeper investigations.
The client now uses the model to predict actual production, the development of bottlenecks, the impact of cleaning policies or lack of operators.
A downstream dashboard is used for deep-dive analysis of simulation outputs.
The client now uses the model to predict actual production, the development of bottlenecks, the impact of cleaning policies or lack of operators.
A downstream dashboard is used for deep-dive analysis of simulation outputs.
PORT LIBRARY
Context
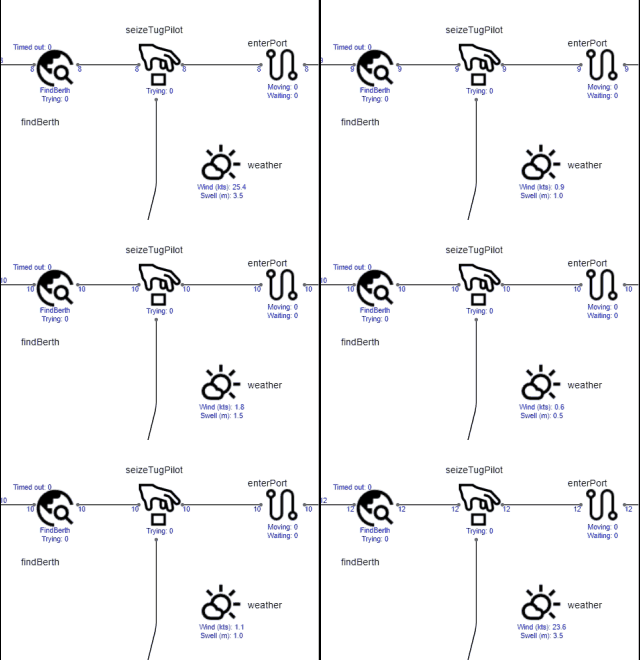
Long-term planning of ports requires simulation of traffic at vastly different scales for varying predicted demands.
So far, the client "bought" simulation models but felt the pain of not owning the models and lacking internal capabilities to adjust and improve.
Hence, they decided to develop a library for port model development, so their team can use that going forward.
So far, the client "bought" simulation models but felt the pain of not owning the models and lacking internal capabilities to adjust and improve.
Hence, they decided to develop a library for port model development, so their team can use that going forward.
Approach
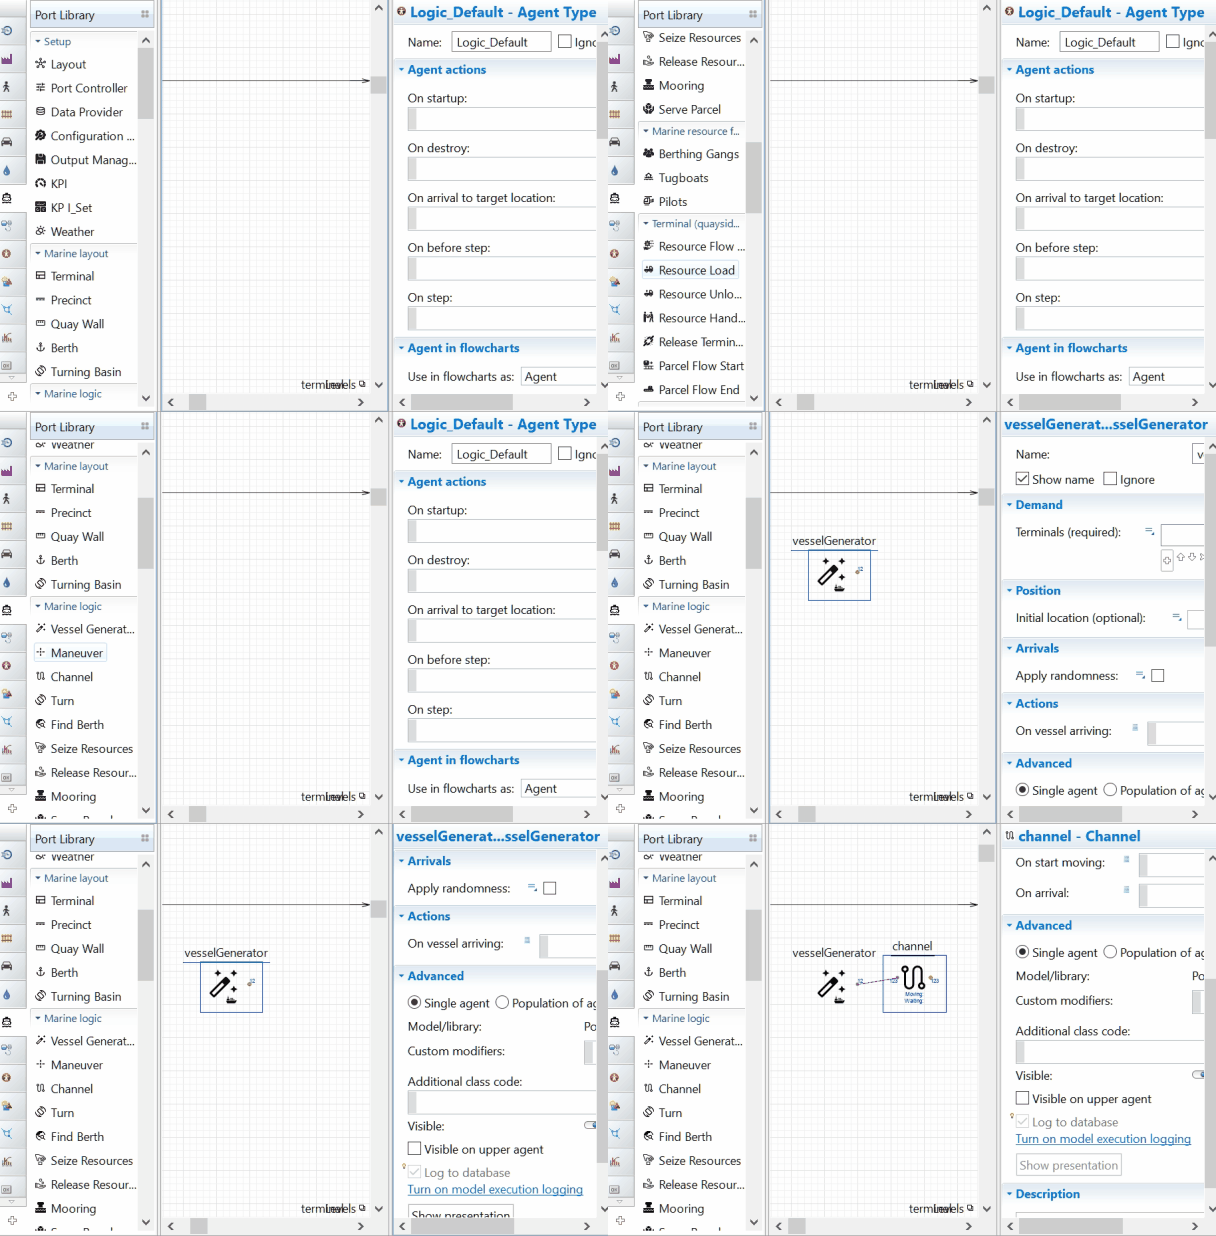
I developed a comprehensive AnyLogic library tuned to building port models fast, elegantly and reliably.
Within an hour, you can develop a model for vessel , truck, train, conveyor and pipeline transport for import, export and trans-shipments.
The library has advanced capabilities to detect unsuitable setups, track KPIs and apply different layouts.
Within an hour, you can develop a model for vessel , truck, train, conveyor and pipeline transport for import, export and trans-shipments.
The library has advanced capabilities to detect unsuitable setups, track KPIs and apply different layouts.
Client impact
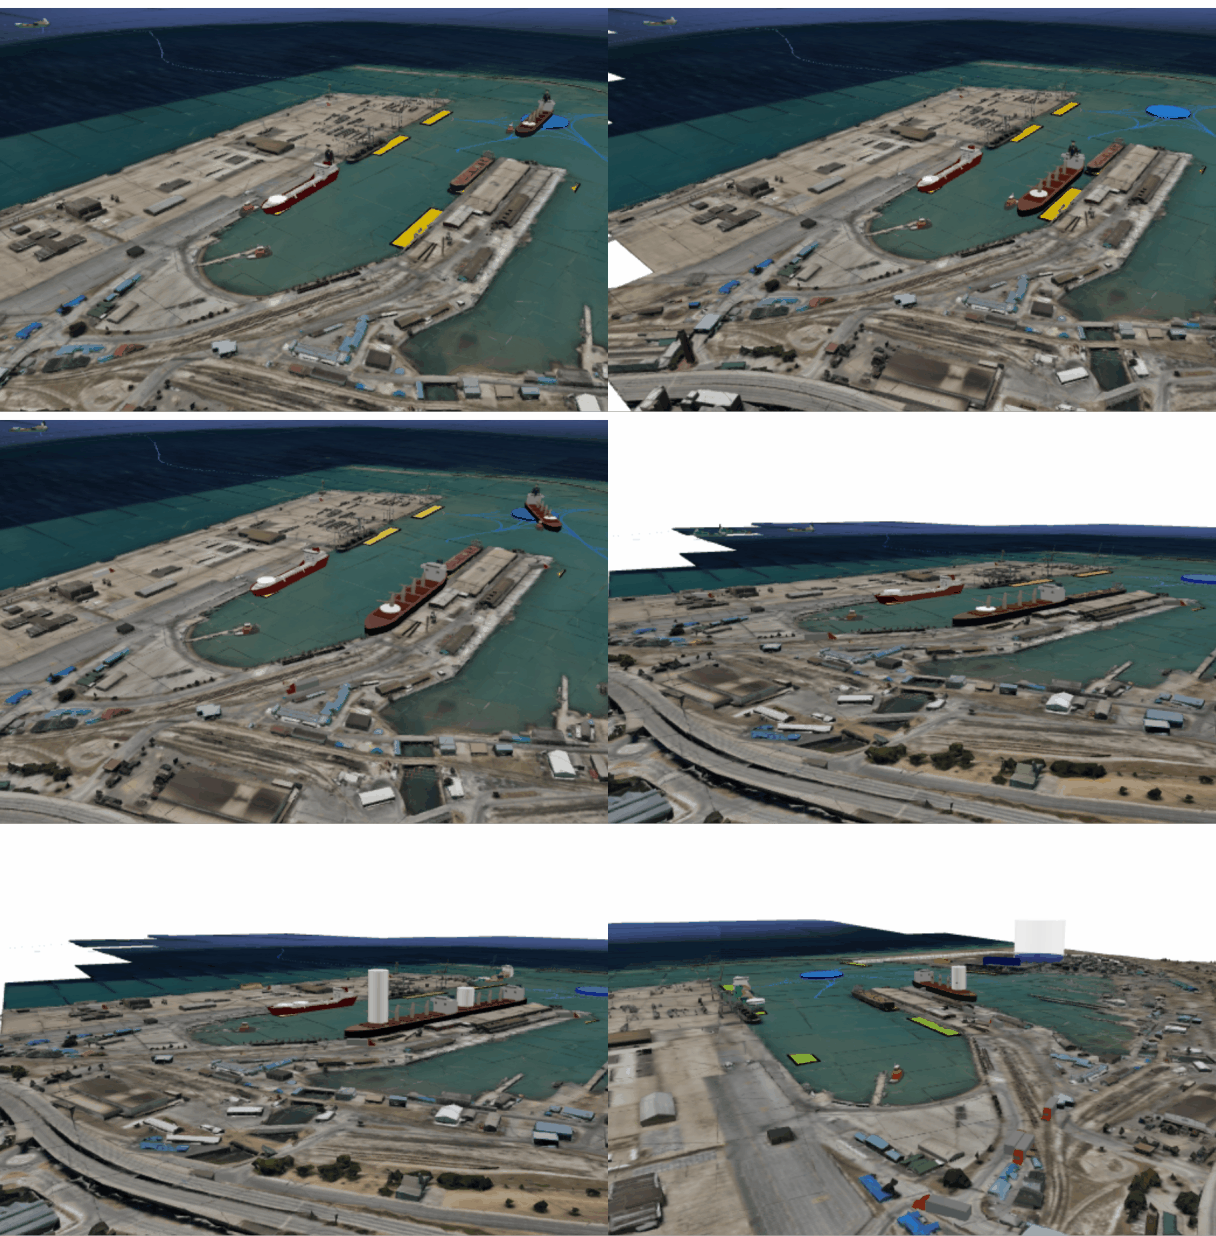
The client built models of all their ports (8), from small simple ports to huge top-tier global ports (50+ berths).
Models include detailed flows of traffic, predicted weather impacts and toggle varying future layouts.
The client applies these for their strategic investment planning. Importantly, they now fully "own" and know their models. Due to the flexibility of AnyLogic, they can extend the library at any time.
CAR FACTORY LOGISTICS
Context
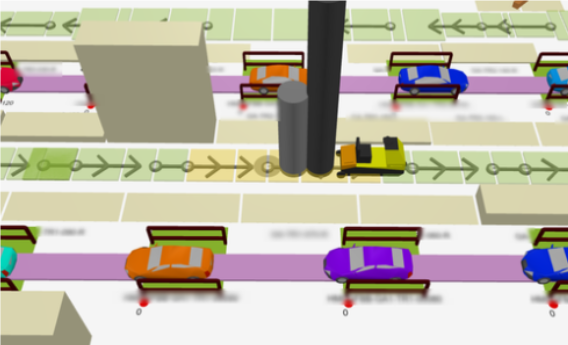
A large electric-car manufacturer opened a new plant and ramps up production very fast.
Traffic within the plant may become a bottleneck due to space constraints, route setup and "soft factors".
Management wants to "stay ahead" of problems by simulating performance upfront.
Traffic within the plant may become a bottleneck due to space constraints, route setup and "soft factors".
Management wants to "stay ahead" of problems by simulating performance upfront.
Approach
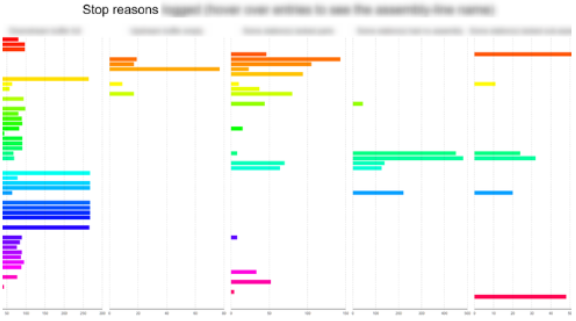
A fully data-driven AnyLogic model re-creates the plant, including assembly lines, tugger routes and part consumption.
I developed a unique spatial setup that allows tugger traffic to be modelled ~100 times faster than traditional traffic models, without loosing critical fidelity.
The model is so generic that it could be be applied to different plants without extra effort.
I developed a unique spatial setup that allows tugger traffic to be modelled ~100 times faster than traditional traffic models, without loosing critical fidelity.
The model is so generic that it could be be applied to different plants without extra effort.
Client impact

The model is used regularly to this day. Both ahead of major design decisions and for small "what would happen if..." queries.
It identifies unexpected bottleneck areas and quantifies the impact of route adjustments, more equipment, different cycle times...
Not least, the model continues to be improved by the internal simulation team, after training and upskilling by me.
It identifies unexpected bottleneck areas and quantifies the impact of route adjustments, more equipment, different cycle times...
Not least, the model continues to be improved by the internal simulation team, after training and upskilling by me.
VACCINE LOGISTICS SUPPORT
Context
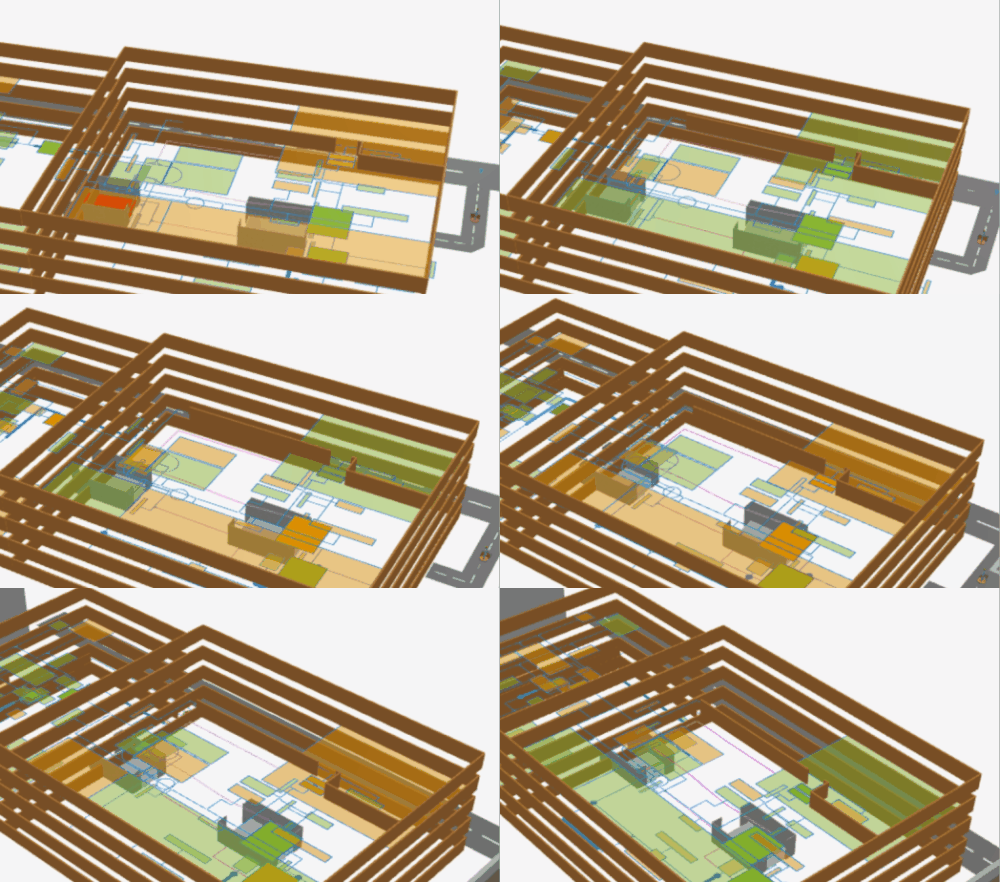
A vaccine manufacturer experienced explosive growth and struggled to keep up with production. The main bottleneck was the physical limitations of the manufacturing plant itself.
They asked IPOL GmbH to help them improve processes and maximize throughput within the physical limitations.
They asked IPOL GmbH to help them improve processes and maximize throughput within the physical limitations.
Approach
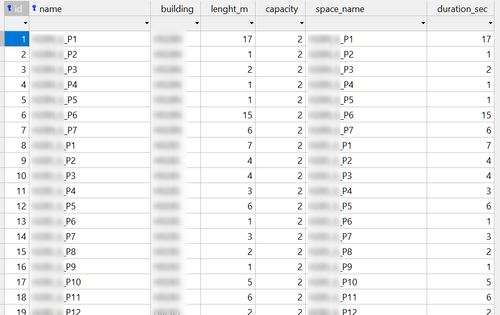
IPOL GmbH envisioned a generic simulation tool that allows automated creation of any client physical layout: sites, buildings, elevators, etc. These would be filled with pedestrians navigating with custom route finding.
We co-developed a powerful AnyLogic model that creates such models from data.
Client impact
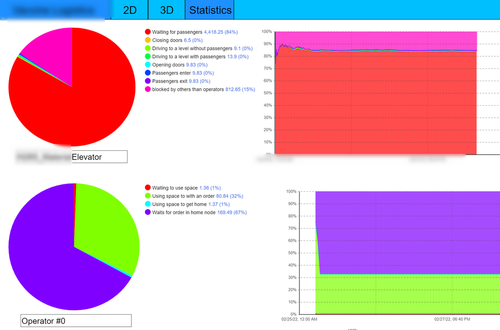
IPOL experts learned advanced AnyLogic modelling techniques while serving their client at the same time.
IPOL plans to re-use the setup for future clients as it is generic enough to be applied for different industries. eduling.
PROJECT PORTFOLIO DIGITAL TWIN
Context
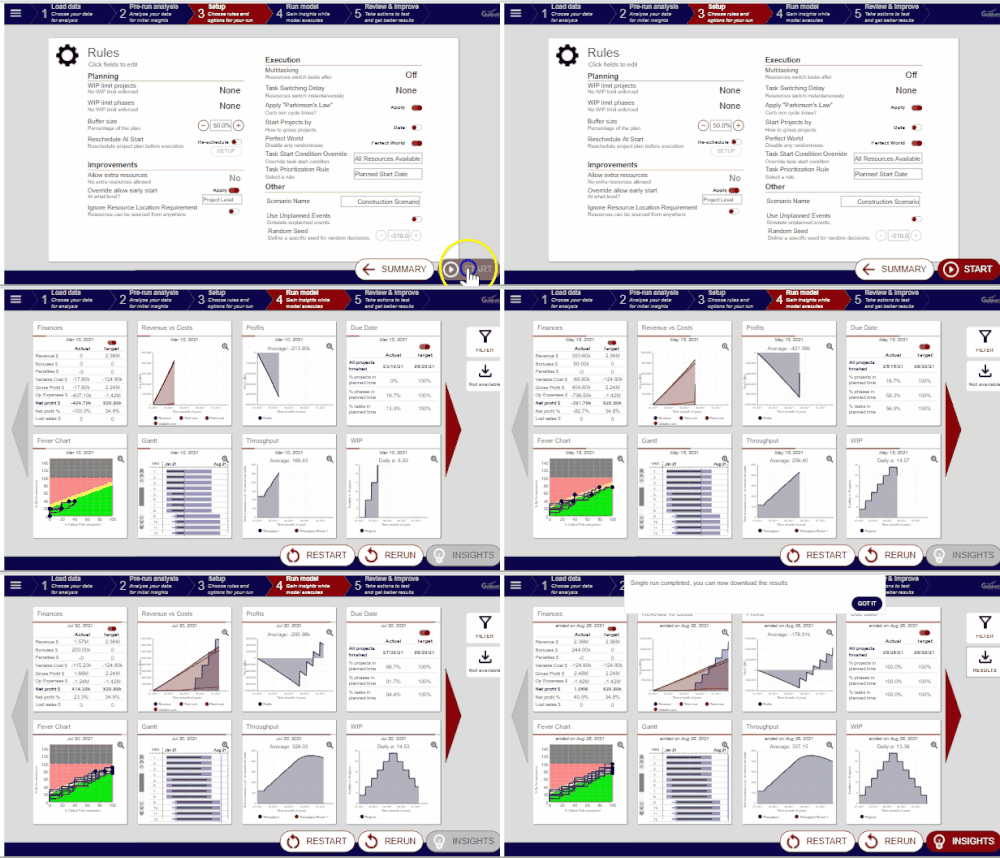
Goldratt Research Labs is a thought leader on “Theory of Constraints”.
They decided to apply their expertise not only in manufacturing and supply chains but bring it to project management, specifically critical-chain project management.
They decided to apply their expertise not only in manufacturing and supply chains but bring it to project management, specifically critical-chain project management.
Approach
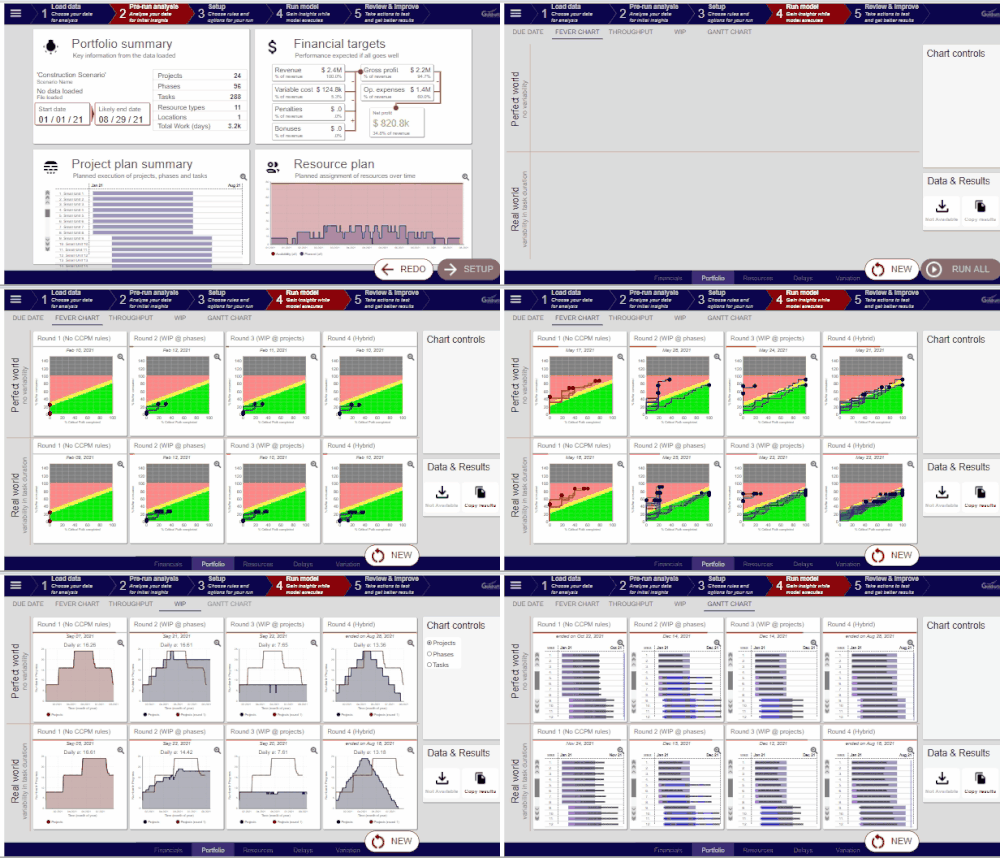
We designed a highly functional, yet intuitive tool to load any project portfolio.
Users can analyze their current situation and simulate the future, testing different policies with real-world uncertainties.
Client impact
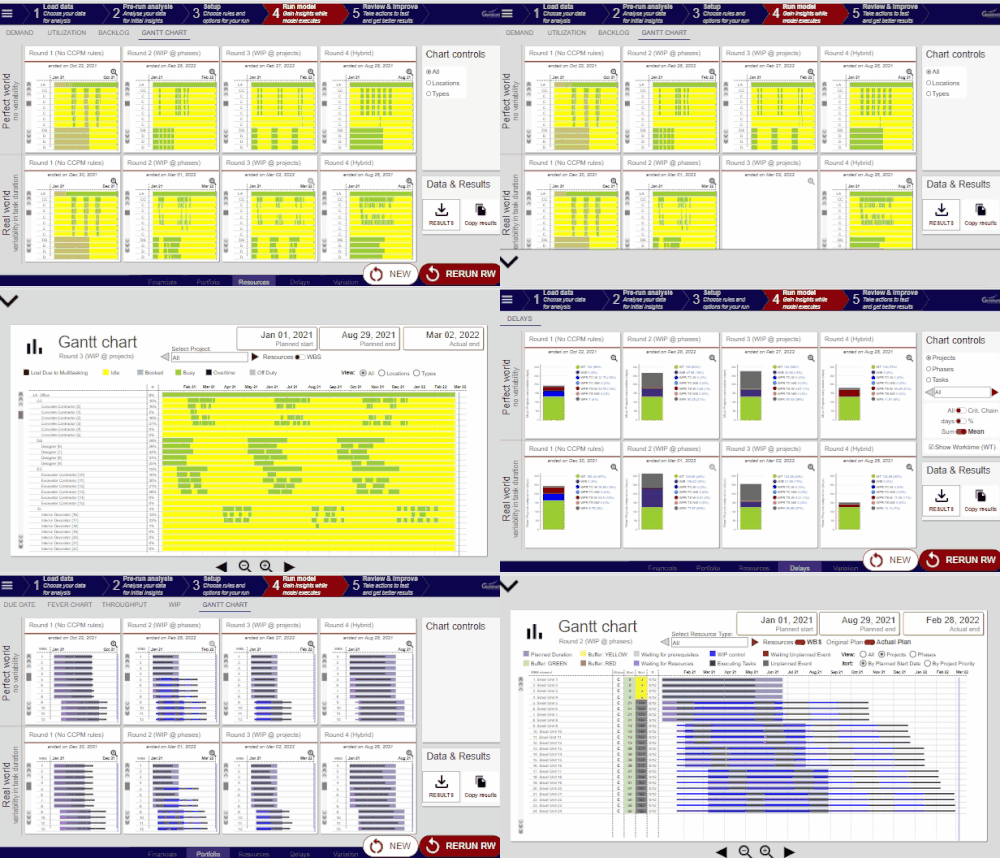
This tool is the most comprehensive way to plan and test your company’s projects. It has features not seen in comparable tools, specifically its ability to actually simulate future uncertainty.
SEMI-CONDUCTOR SCHEDULING OPTIMIZATION
Context

Manufacturing semi-conductors is incredibly complex, requiring dozens of steps on just as many machines.
The client relied on traditional Excel-based scheduling driven by human experience alone.
The client relied on traditional Excel-based scheduling driven by human experience alone.
Approach
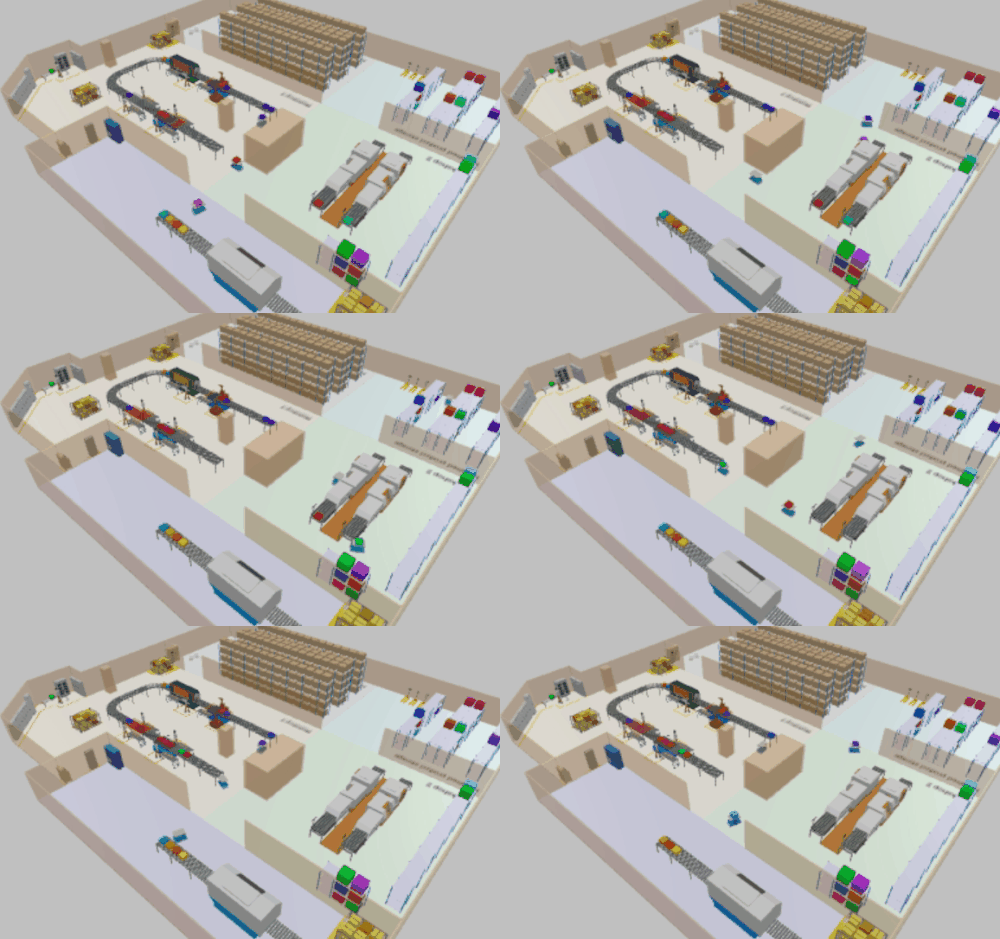
I developed a highly detailed digital twin of client operations while retaining high-performance to enable optimization of schedules.
This required very advanced modelling techniques with low-level coding and assemblies.
Client impact
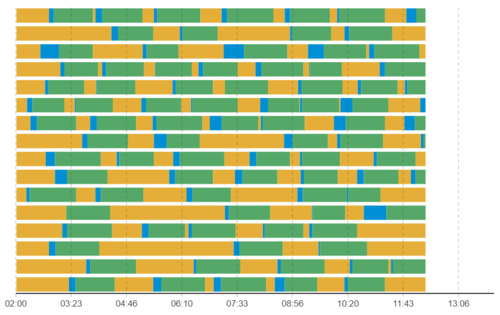
The initial prototype convinced the client to invest into a very large study to turn this into the new scheduling tool.
I pulled in additional resources to kickstart full development. The product is being used every day since it has been developed.
I pulled in additional resources to kickstart full development. The product is being used every day since it has been developed.
COVID-19 FACILITY SIMULATION TOOL
Context
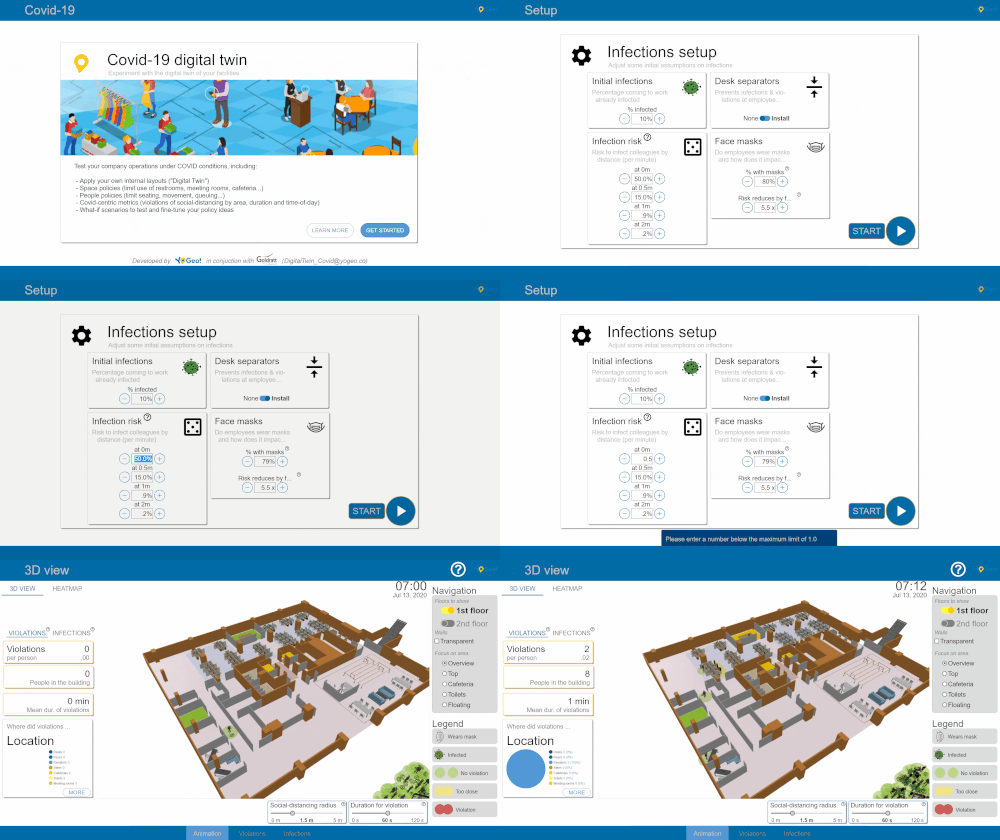
During the Covid-19 pandemic of 2020, many offices and factories were forced to re-structure their processes around social-distancing.
The Silicon-Valley startup Yogeo asked me to create a generic tool to help solve those issues.
Approach
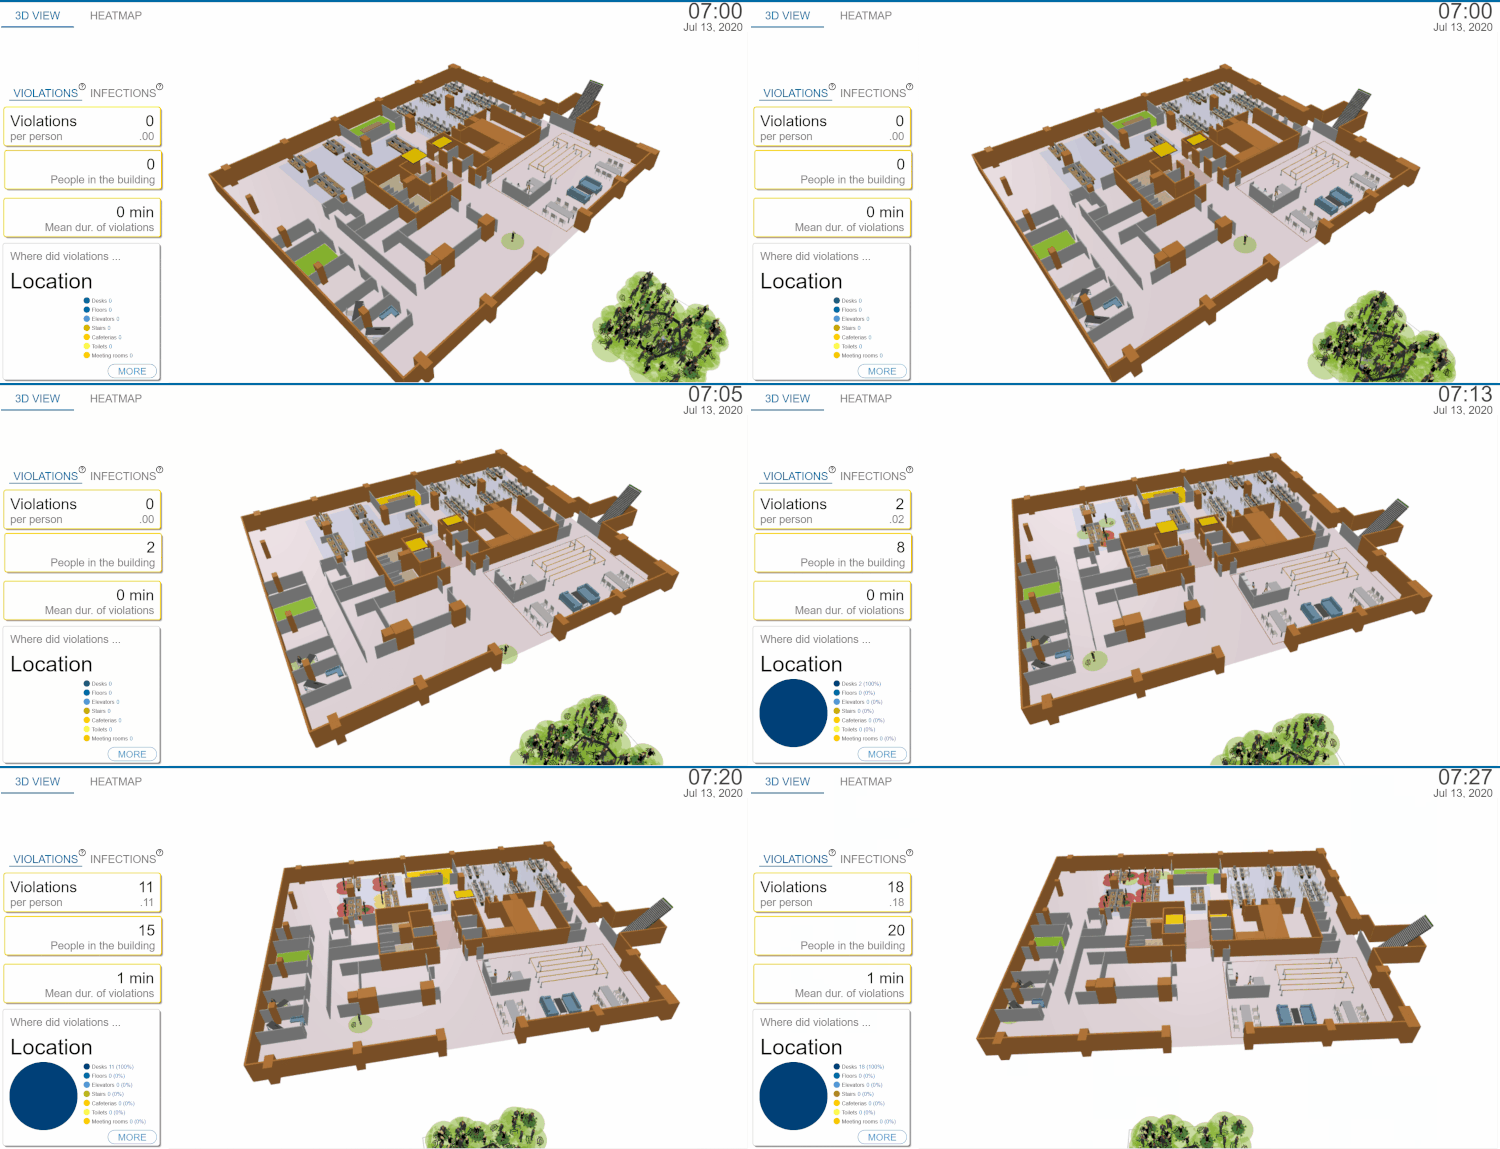
I created a “quasi” library of typical blocks like spaces, desks, toilets or cafeterias.
Users can drag these in themselves and link them with spatial elements to re-create any real setup within minutes.
Users can drag these in themselves and link them with spatial elements to re-create any real setup within minutes.
This is a unique approach combining logic and animation in AnyLogic.
Client impact
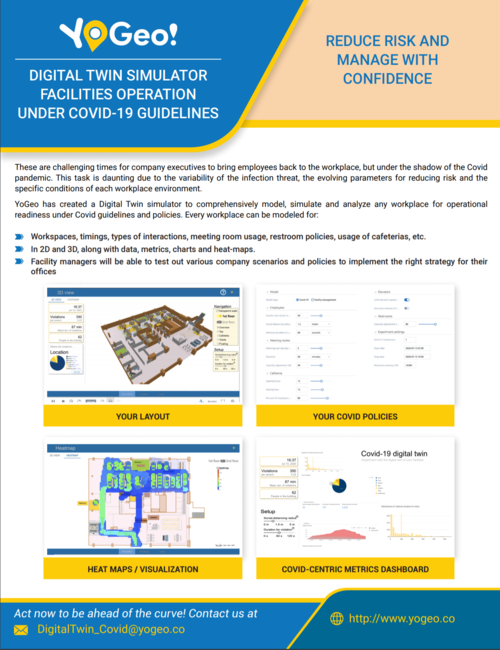
Yogeo applied the tool to discuss implementations with clients.
They also used the library elements to adjust my demo layout for their own client needs, proving the simplicity it provides.
To this day, the model is one of the most successful models on the AnyLogic Cloud.
They also used the library elements to adjust my demo layout for their own client needs, proving the simplicity it provides.
To this day, the model is one of the most successful models on the AnyLogic Cloud.
PRODUCT PORTFOLIO DIGITAL TWIN
Context
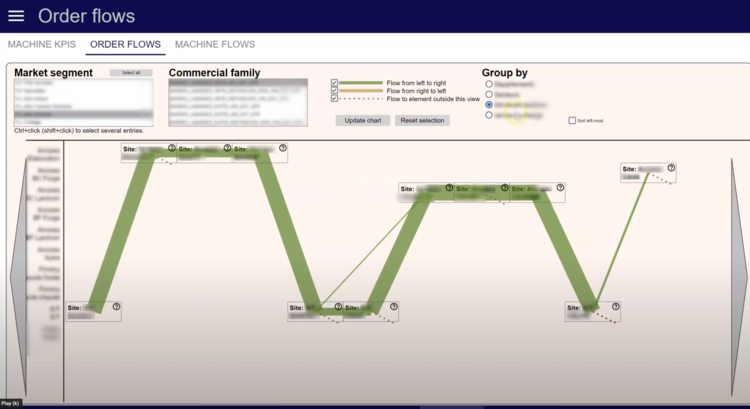
- Aerospace super-alloy manufacturer with complex product portfolio
- Client wanted to evaluate impact of future (simplified) product portfolio on cost, revenue and machine utilization
- 10000+ different SKUs with very complex flows across several plants
Approach
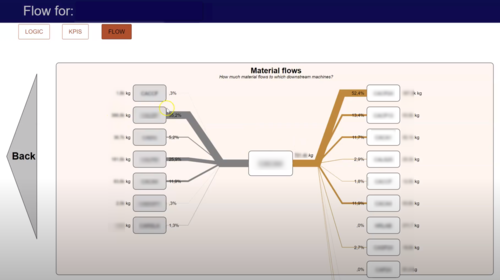
- Data-driven, self-configuring model of all plants and machines
- SKUs follow required production flows and accrue costs and revenue
- Easy setup of new product portfolio scenarios
- Innovative data visualization
Client impact
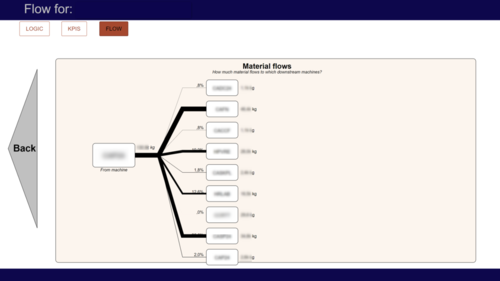
- First time client was able to see actual product flows for any group across any machine
- Recommended several future portfolios with respective impact on cost and revenues
MATERIAL DESIGN: UI LIBRARY FOR ANYLOGIC
Context
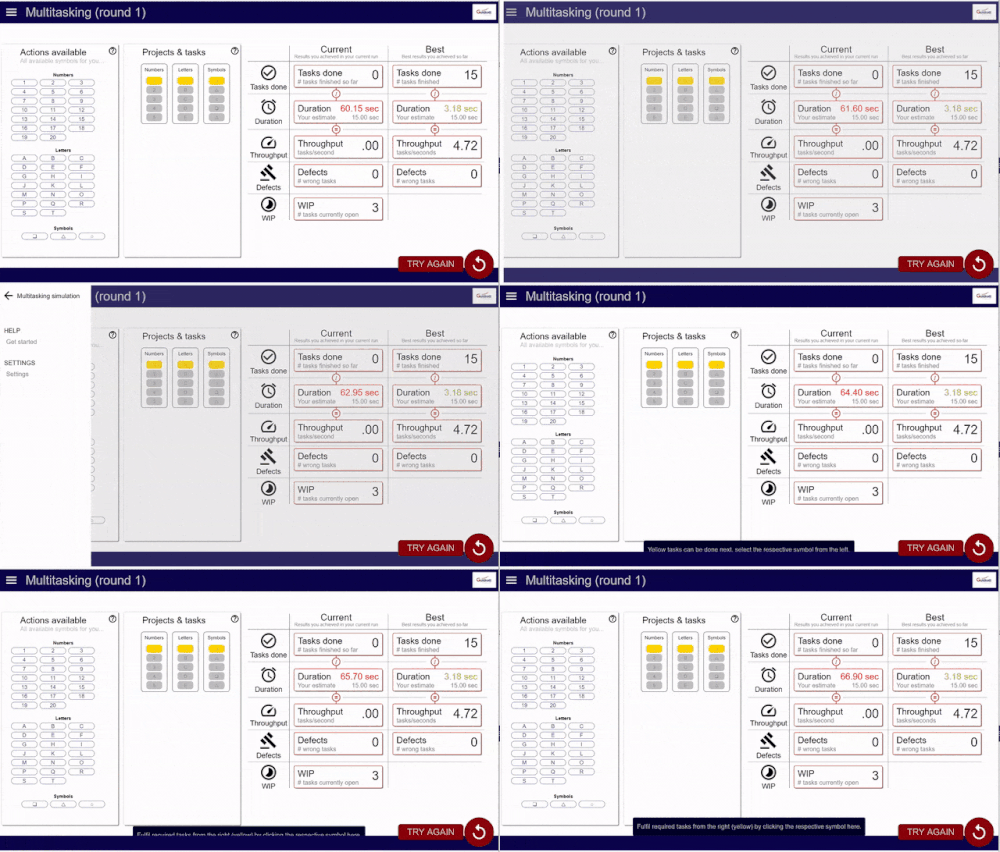
The AnyLogic simulation tool offers great simulation capabilties. However, the default model user interface (UI) is often old-fashioned and not intuitive.
Why not move to UI that we are all familiar with, i.e. modern app design?
Why not move to UI that we are all familiar with, i.e. modern app design?
Approach
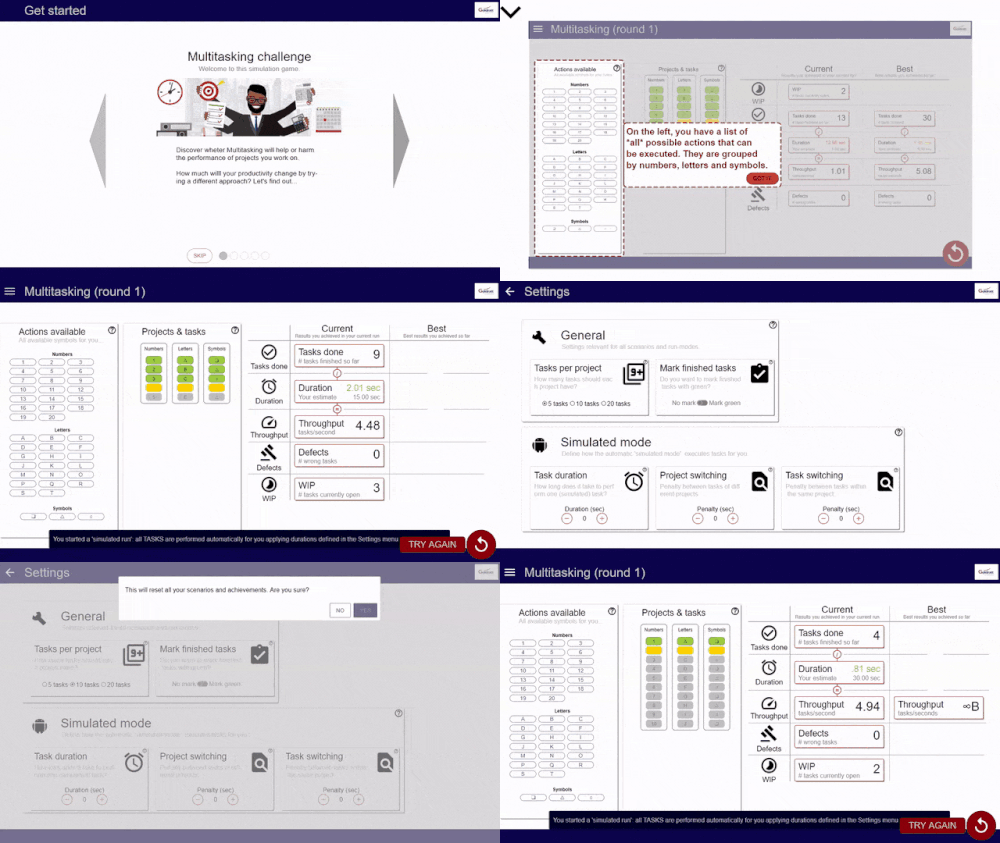
Together with Goldratt Research Labs, we decided that great models benefit from good UI.
We developed the first commercial AnyLogic library where users can create amazing UI within minutes that look and feel like modern apps.
We developed the first commercial AnyLogic library where users can create amazing UI within minutes that look and feel like modern apps.
Client impact
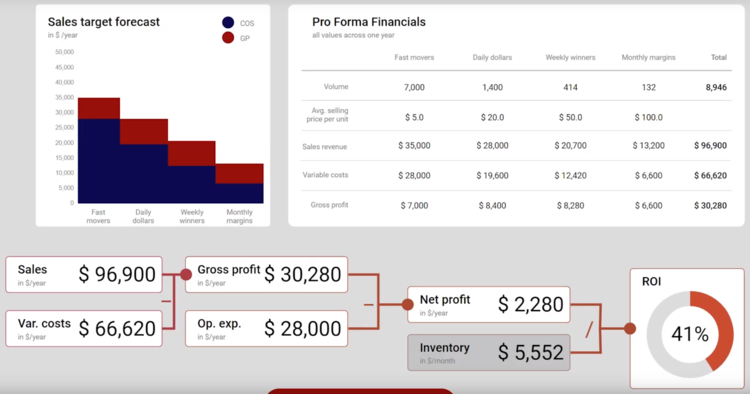
Goldratt Research Labs now develops all their simulation tools with our Material Design library.
Other customers around the world use it every day and shorten their model design time while improving visuals massively.
INVENTORY MANAGEMENT DIGITAL TWIN
Context
Goldratt Research Labs is a leading provider in helping clients to make “better faster decisions when it really matters”.
For their clients, they use simulation models extensively to train insights into inventory management policies. The goal is always to reduce shortages and surpluses in retail.
For their clients, they use simulation models extensively to train insights into inventory management policies. The goal is always to reduce shortages and surpluses in retail.
Approach
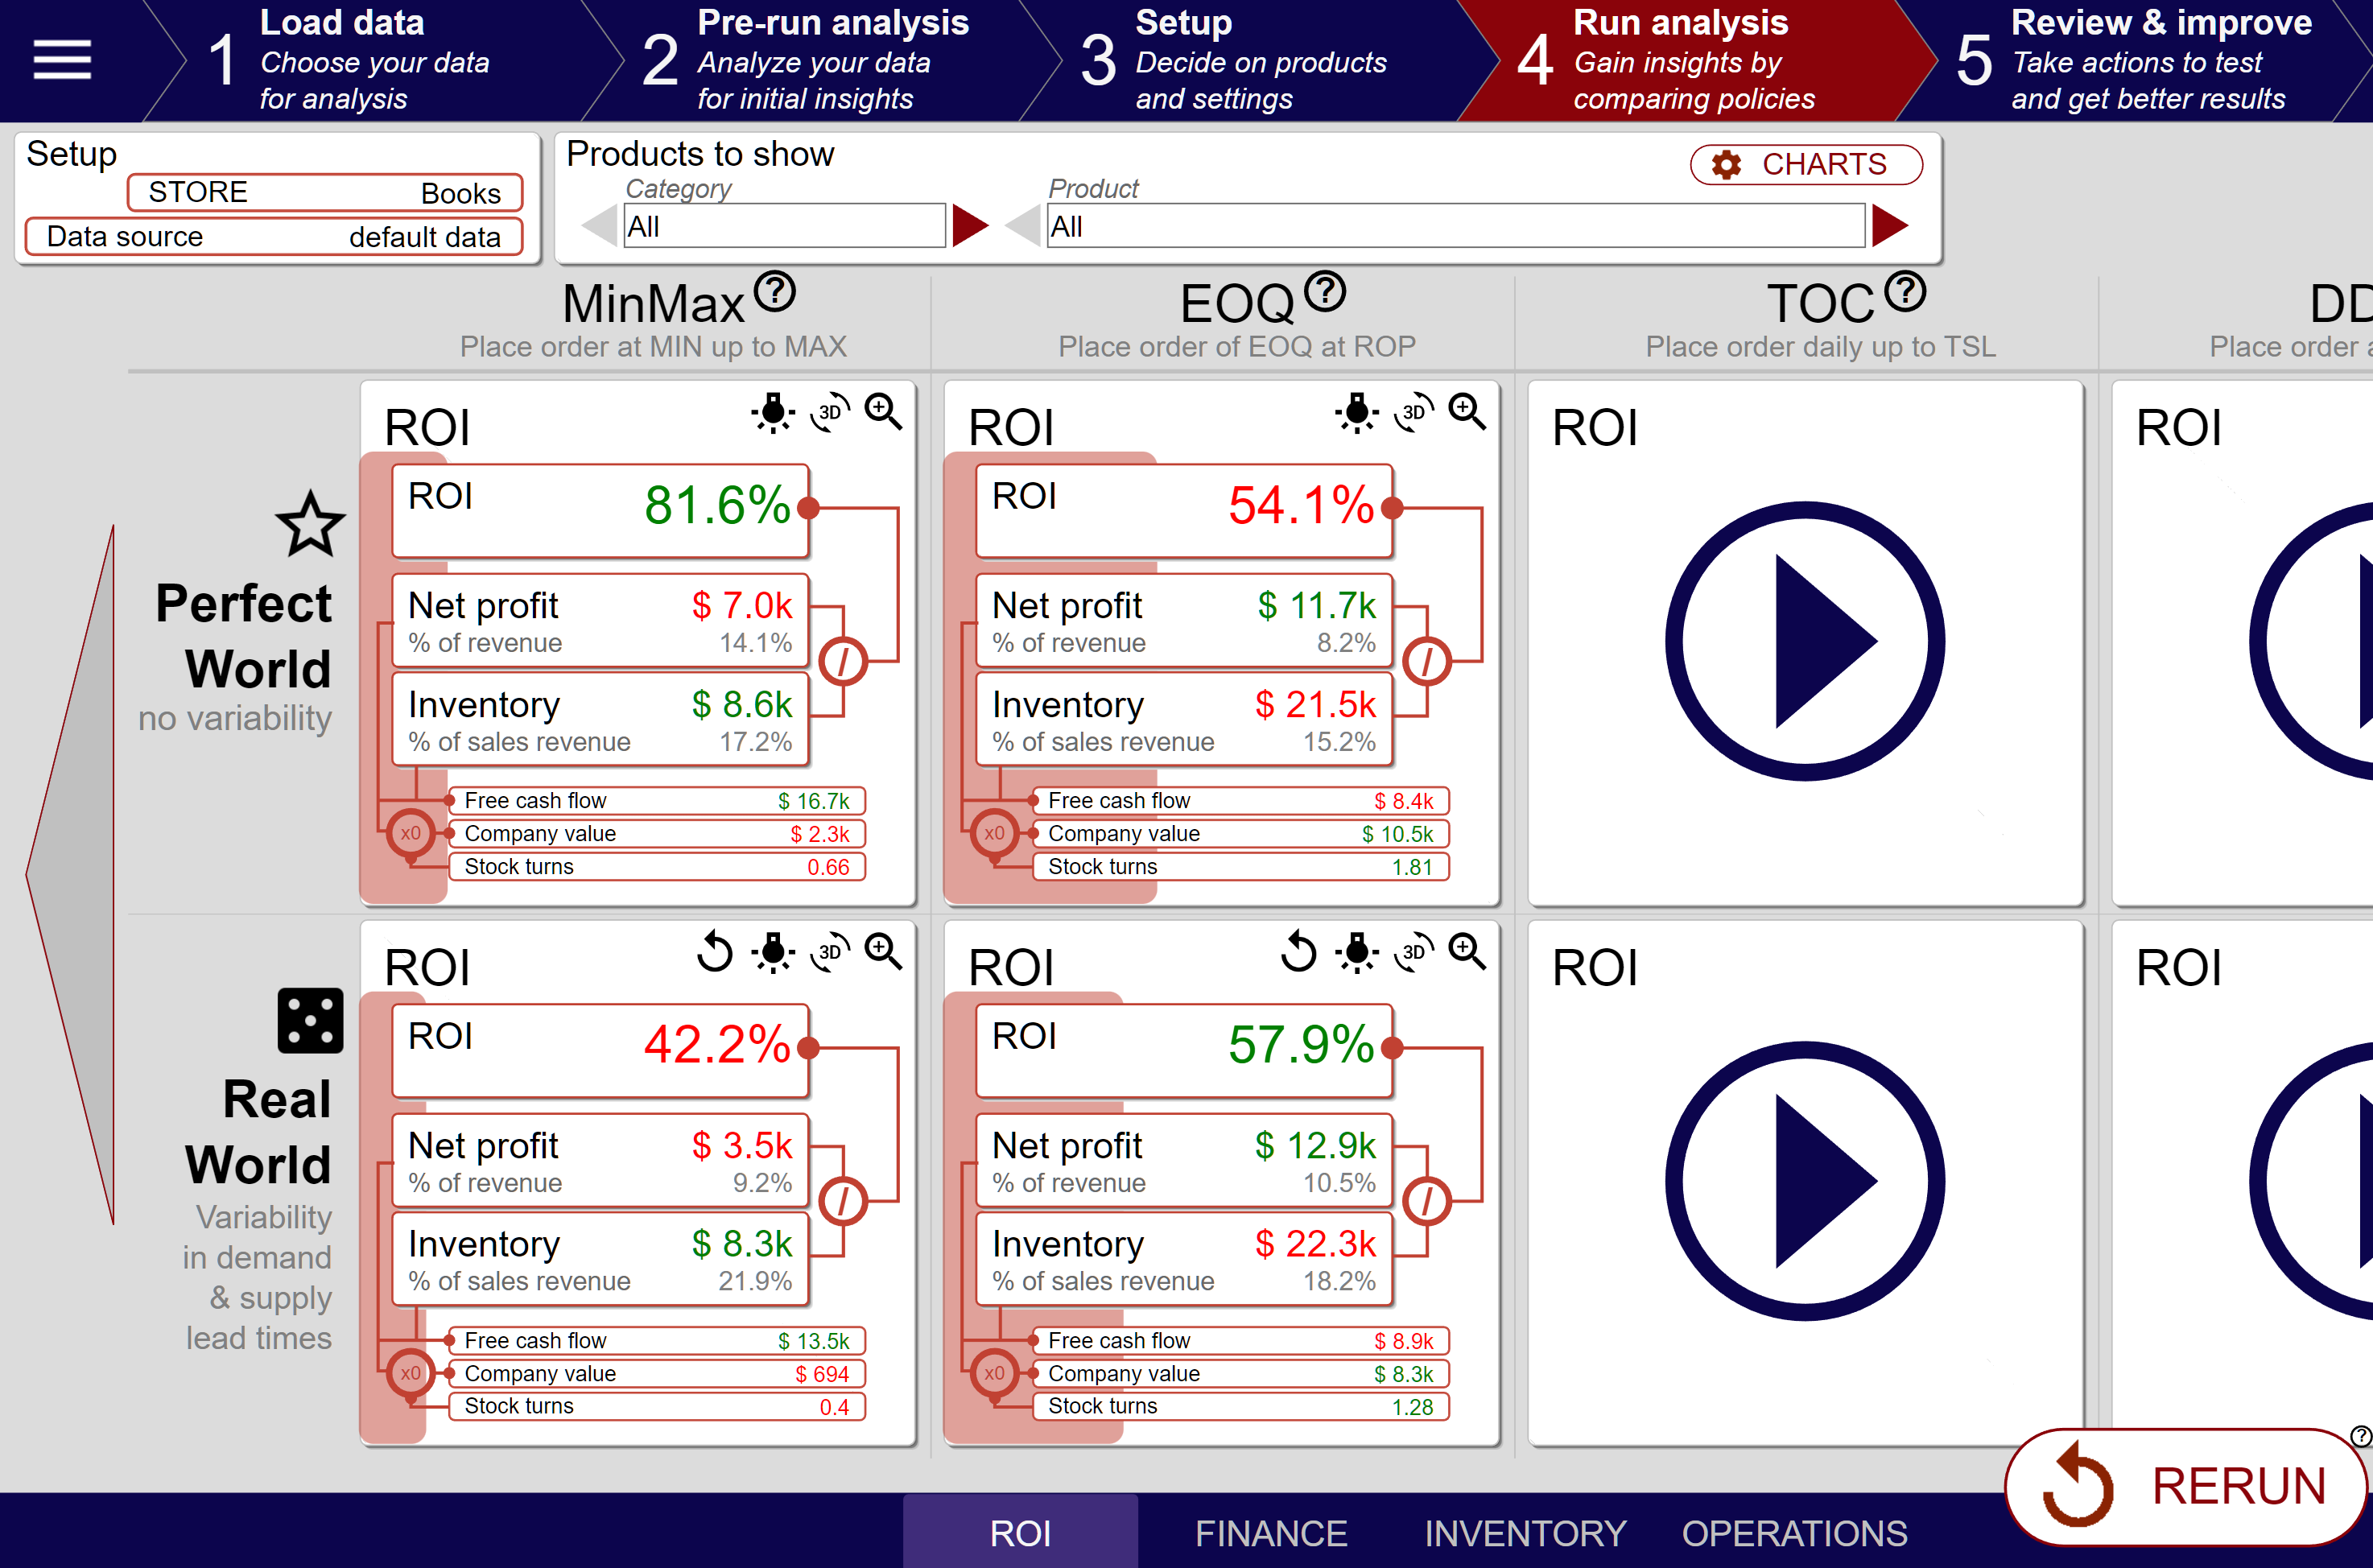
Based on Eli Goldratt’s famous book “Isn’t it obvious”, we built a digital twin of a retail store and a distribution center.
Uniquely, the simulation “tells a story” and takes the user through a learning journey, also applying intuitive user interfaces and charts.
Uniquely, the simulation “tells a story” and takes the user through a learning journey, also applying intuitive user interfaces and charts.
Client impact
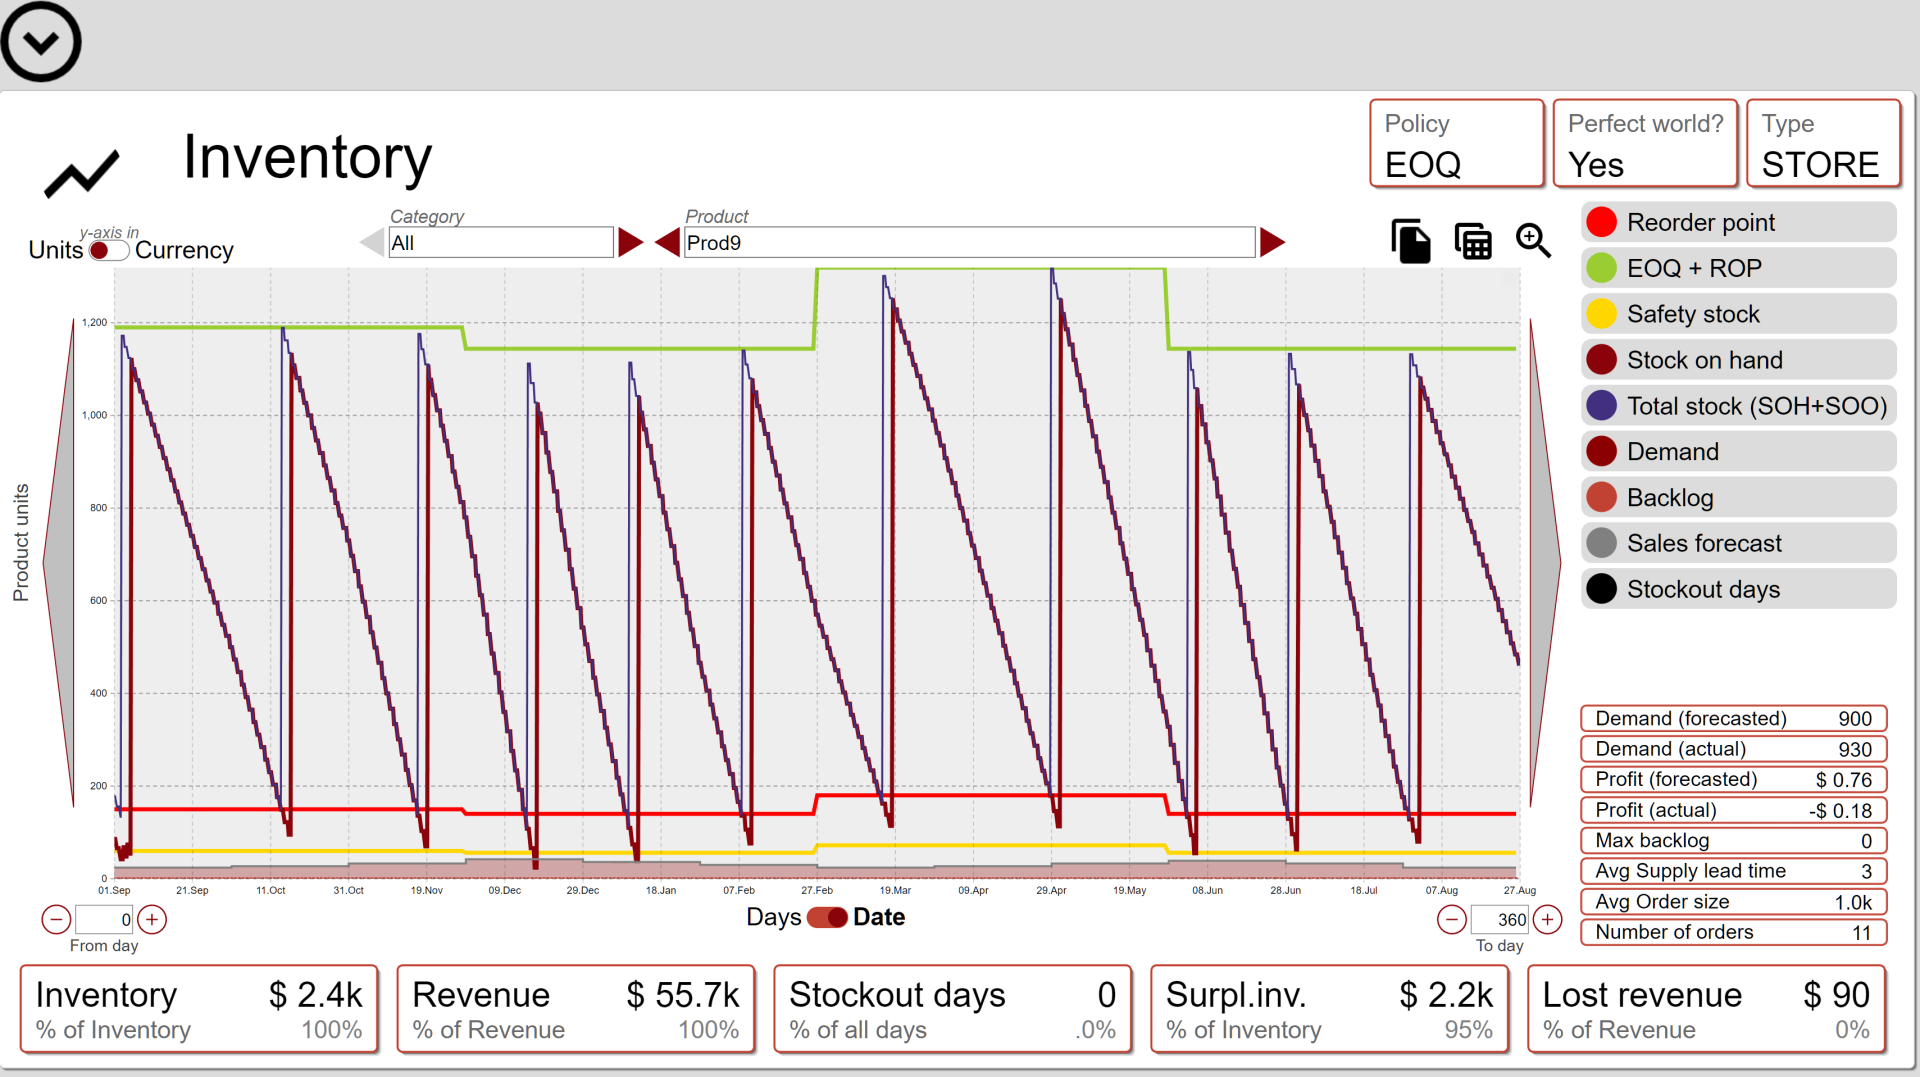
The model is used extensively in client training to educate about the advantages of “theory-of-constraints” inventory management over traditional approaches.
Recently, the model was extended to include DDMPR policies as well. Moreover, it is now a full digital-twin that clients can apply to real data and situations.
ALUMINIUM PLANT DIGITAL TWINS
Context
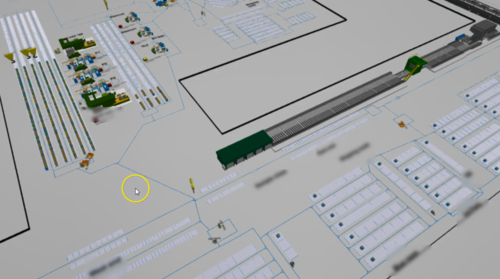
Two client flat-rolled aluminium plants faced dynamic bottlenecks in North America and Europe. This was caused by several issues that could often not be identified.
Several improvement ideas existed but it was impossible to analyse which one would be the best.
Several improvement ideas existed but it was impossible to analyse which one would be the best.
Approach
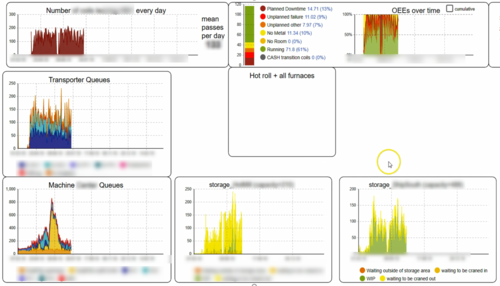
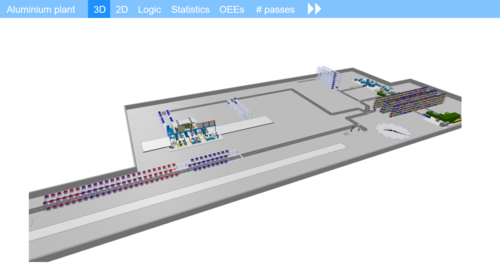
I designed a full “digital twin” simulation model of each plant, modelling individual coil flow through all machines.
After calibrating for 95% accuracy on historic data, we tested several scenarios to improve throughput and OTIF.
After calibrating for 95% accuracy on historic data, we tested several scenarios to improve throughput and OTIF.
Client impact
The simulation model was the key tool to decide between scenarios.
The chosen scenarios lead to an increase of throughput by 10%, a WIP reduction of over 5% and a lead-time improvement of over 1 day.
The chosen scenarios lead to an increase of throughput by 10%, a WIP reduction of over 5% and a lead-time improvement of over 1 day.
STEEL-PIPE SUPPLY CHAIN
Context
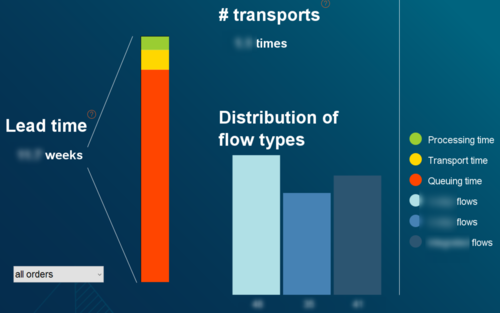
- Client manufacturer has several sites across Europe, each managing production steps for steel pipes (rolling, heat treatment, threading…)
- Current shipping is planned ad-hoc, creating large overhead
- Impossible to optimize due to complexity
- Simulation could help test new planning rules
Approach
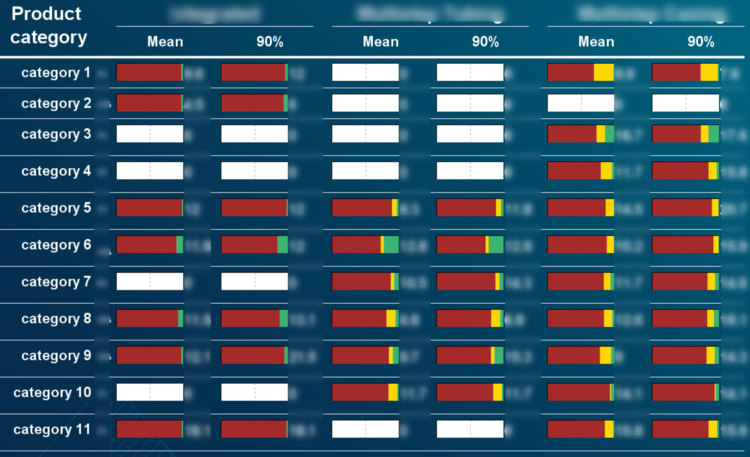
- Create AnyLogic model re-creating production sites, current shipping strategies and cost structure
- “Train the trainer” approach: taught client resource in simulation modelling so he could help with model development from week 3
- Initial results created within 2 weeks, refined iteratively
Client impact
- Tested 8 policies and ranked by various goals
- Ranking led to further refinement of initial policy ideas. Those were retested in the model again
- Left client capable of further model work and developing new models for different problems
GOLD MINE DIGITAL TWIN
Context
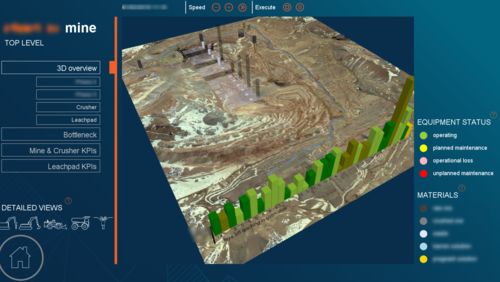
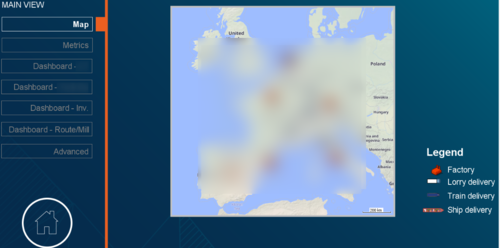
- Sub-optimal performance due to shifting bottlenecks
- Client did not understand why bottlenecks appear. Classic OEE analysis cannot help here
- Client developed improvement ideas but could not predict impact
Approach
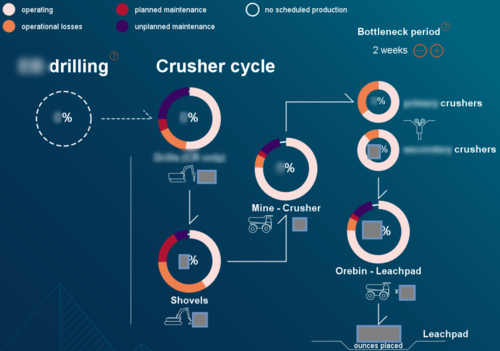
- A highly accurate mine model was designed using AnyLogic
- Including all assets (trucks, drivers, drills, crushers…), failure modes
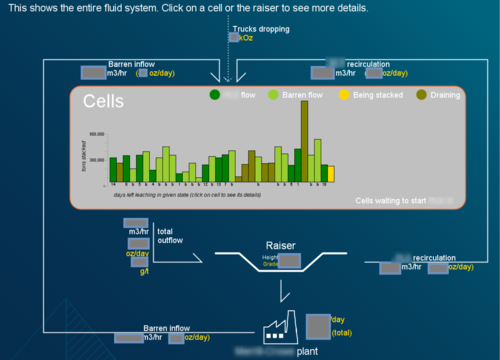
- Uniquely, we modelled the ore and leachpad operations as well using the fluid library and chemical reactions
Client impact
- 12 man-week effort led to a highly accurate model (reproduced the past within 5%)
- Identified up to 1m tons of material loss reduction
- Predicted unexpected future bottlenecks
- Daily operational use due to self-explanatory UI design
S & OP PLANNING
Context
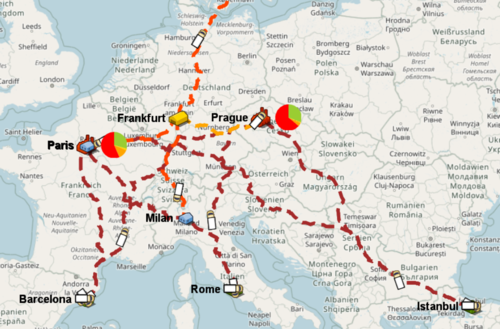
- S&OP (Sales and operations planning) is often done without a full understanding of the system dynamics
- Educating S&OP professionals about unexpected problems is very important
- “Serious games” can help by experiencing a virtual S&OP environment
Approach
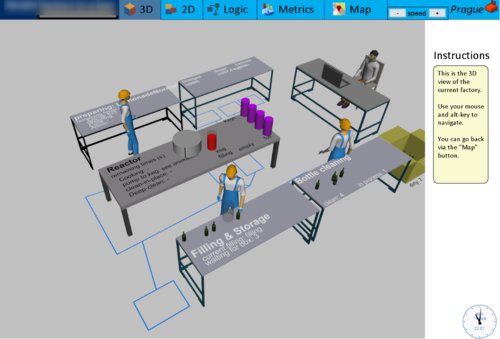
- We built a “digital twin” of a lemonade business with suppliers, factories and DCs across Europe
- Uniquely, the model recreates individual factory dynamics down to individual bottles
- Data-driven setup that users can easily adjust at runtime
Client impact
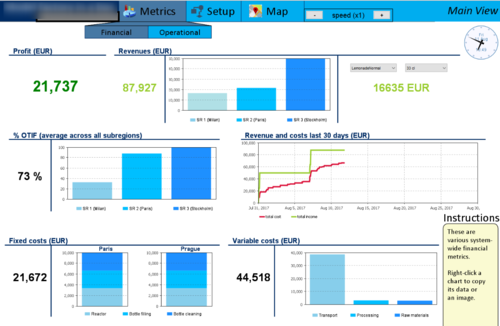
- Used regularly for training of clients of a large management consulting firm
- Extended existing (real) “serious game” of a lemonade factory with a virtual S&OP component
- Users report on the unexpected and fun aspect of training for S&OP end-to-end
AIRCRAFT-ENGINE-FLEET DIGITAL TWIN
Context

Our client leases a big chunk of their engines to airlines, instead of selling them. All risk on downtimes and repairs is on the manufacturer.
Therefore, predicting downtimes and managing repair shop availability is crucial to their business model. A strategic and live digital twin of the aircraft fleet can help.
Therefore, predicting downtimes and managing repair shop availability is crucial to their business model. A strategic and live digital twin of the aircraft fleet can help.
Approach

We created one of the most complex AnyLogic models at the time, modelling aircraft engines down to individual screws. The model was fed from live and historic data.
Part failures could cause cascades of errors and predictive maintenance became feasible for the first time
Client impact
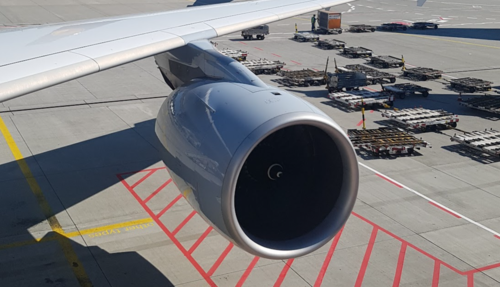
The tool became an integrated part of the manufacturer’s live operations.
It is still applied every day to predict on short- and long-term fleet performance.
It is still applied every day to predict on short- and long-term fleet performance.
It has helped to shape major investment decisions on overhaul facilities.
REME MAINTENANCE PLANNING
Context
The UK Ministry of Defense (MoD) sends helicopter maintenance personnel to crisis areas along with the pilots. Naturally, this creates a lot of stress, leading to a high rate of people leaving out of frustration.
Given the high cost of training, the MoD wanted to see if better crew handling could improve morale.
Approach
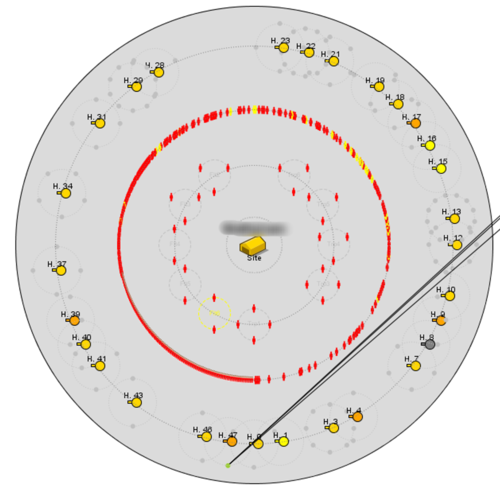
We created an agent-based model of maintenance personnel, helicopters, training exercises and deployments.
Personnel agents had an internal “psychology” state model of their mood, influenced by their day-to-day activities.
Client impact
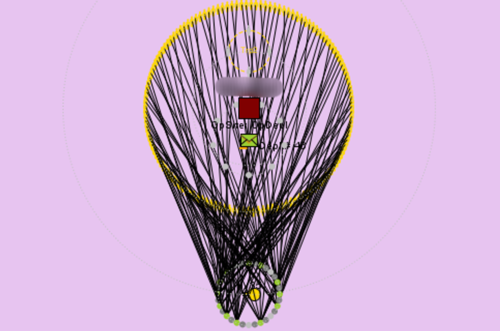
We showed that rate of personnel leaving could be reduced substantially by slicing “nights away from home” into shorter segments.
The client applied the model to investigate real training schedules and upcoming deployments to apply improved scheduling.

